Converting Gnuplot graphs with Ghostscript
May 26, 2011 at 9:01 PM by Dr. Drang
I have to generate graphs quite often, and in the last week or so I spent some time thinking about how I could make the process go more smoothly. After going down a few blind alleys, I came up with two scripts that do what I want.
Before we look at the scripts, you should know that I use Gnuplot for all my graph making. I gave up Excel a long time ago and Numbers is hopeless with graphs, but I can always count on Gnuplot. It is decidedly not easy to get into because it works through typed commands rather than point-and-click, but once you know its tricks things go pretty quickly. Most important, when you need to generate several graphs of the same style, Gnuplot lets you write the commands that set the style once and reuse them as a script again and again.
Gnuplot can create graphs in many file formats; for reports I usually use its Encapsulated PostScript (EPS) generator, invoked by the command
set terminal postscript eps
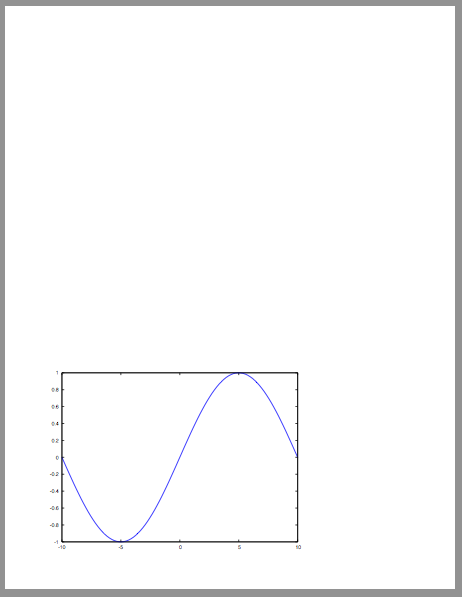
This creates EPS files that are 5 inches wide and 3.5 inches high, a good size for a half-page plot in a report. The problem is that pdflatex, which is what I use to make my reports, doesn’t like EPS graphics files, it prefers PDFs. For far too long, I’ve been using my old standby, ps2pdf, to transform the EPS plots into PDFs. It works, but it expands the white space around the plot to make the resulting PDF file letter-sized.

To get rid of the white space, I always had to open the PDF in Preview (which is where I got that screenshot) and crop it down to the right size. A waste of time.
Hence my first script, eps2pdf. It works just like ps2pdf in that it uses Ghostscript—which comes with most TeX installations for the Mac—to do the conversion, but it adds one more option that tells Ghostscript to honor the BoundingBox line in the EPS file.
bash:
 1:  #!/bin/sh
 2:
 3:  # Convert Encapsulated PostScript to PDF, retaining the Bounding Box.
 4:  # Just like the standard ps2pdf, but with one extra Ghostscript option.
 5:
 6:  # Currently, we produce PDF 1.4 by default, but this is not guaranteed
 7:  # not to change in the future.
 8:  version=14
 9:
10:  ps2pdf="`dirname $0`/ps2pdf$version"
11:  if test ! -x "$ps2pdf"; then
12:   ps2pdf="ps2pdf$version"
13:  fi
14:  exec "$ps2pdf" -dEPSCrop "$@"
If you have ps2pdf on your system, you’ll see that this is just a simple edit of it. The -dEPSCrop option in Line 14 is what tells Ghostscript to crop the output file to match the EPS’s BoundingBox. This one simple change means I no longer have to crop PDFs by hand in Preview.
The second script is for converting EPSs into PNGs. If you have a version of Gnuplot that’s been compiled with PNG output support,1 you may think this script is unnecessary. But I don’t like Gnuplot’s PNG output. It’s a pain in the ass to use because it doesn’t know where to look on the Mac for TrueType fonts, and even after you tell it, it doesn’t understand the Mac’s .dfont format. So you have to figure out how to extract the TrueType fonts from a .dfont and save them separately, then tell Gnuplot how to find them, and then…and then the graphs you end up with after all that look kind of crappy anyway. The fonts are spindly and the lines in the graph are jaggy.
Which brings me to eps2png. Like eps2pdf, it’s a slightly edited version of a script bundled with Ghostscript—in this case, ps2pdfwr.
bash:
 1:  #!/bin/sh
 2:
 3:  # This definition is changed on install to match the
 4:  # executable name set in the makefile
 5:  GS_EXECUTABLE=gs
 6:  gs="`dirname $0`/$GS_EXECUTABLE"
 7:  if test ! -x "$gs"; then
 8:   gs="$GS_EXECUTABLE"
 9:  fi
10:  GS_EXECUTABLE="$gs"
11:
12:  OPTIONS="-dSAFER"
13:  while true
14:  do
15:   case "$1" in
16:   -?*) OPTIONS="$OPTIONS $1" ;;
17:   *)  break ;;
18:   esac
19:   shift
20:  done
21:
22:  if [ $# -lt 1 -o $# -gt 2 ]; then
23:   echo "Usage: `basename $0` [options...] (input.[e]ps|-) [output.png|-]" 1>&2
24:   exit 1
25:  fi
26:
27:  infile="$1";
28:
29:  if [ $# -eq 1 ]
30:  then
31:   case "${infile}" in
32:     -)    outfile=- ;;
33:     *.eps)  base=`basename "${infile}" .eps`; outfile="${base}.png" ;;
34:     *.ps)   base=`basename "${infile}" .ps`; outfile="${base}.png" ;;
35:     *)    base=`basename "${infile}"`; outfile="${base}.png" ;;
36:   esac
37:  else
38:   outfile="$2"
39:  fi
40:
41:  # We have to include the options twice because -I only takes effect if it
42:  # appears before other options.
43:  exec "$GS_EXECUTABLE" $OPTIONS -q -dNOPAUSE -dBATCH -dEPSCrop -sDEVICE=png16m -dGraphicsAlphaBits=4 -dTextAlphaBits=4 -sstdout=%stderr "-sOutputFile=$outfile" $OPTIONS -f "$infile"
The only change is in the last line, which adds options telling Ghostscript to generate a PNG that honors the BoundingBox and uses antialiasing on both the text and the lines drawn in the graph. I’ll leave it to you to figure out which option those are.
Now I can create PNGs of my graphs in a fully automated way instead of taking screenshots out of AquaTerm, which is how I used to do it.
There’s not much of my work in either of these scripts. The time-consuming part was figuring out which scripts to alter and which of Ghostscript’s huge number of options to use. But I’m not interested in pride of authorship; I just want something that works and works automatically.
-
I have never been able to compile Gnuplot with PNG support on a Mac. No matter what I do, no matter whose instructions I follow, some support library or another doesn’t work and the compilation fails. Recently, though, the precompiled Gnuplot that’s bundled with this precompiled Octave has PNG support. Yippee! I thought, until I actually tried it. ↩
