Boussinesq and Newmark
April 25, 2024 at 1:31 PM by Dr. Drang
In a post this morning, John D. Cook listed several types of partial differential equation that are unusual in that they can be solved analytically. The last one in his list caught my eye because it’s one that I know pretty well from the theory of elasticity: Boussinesq’s equation.
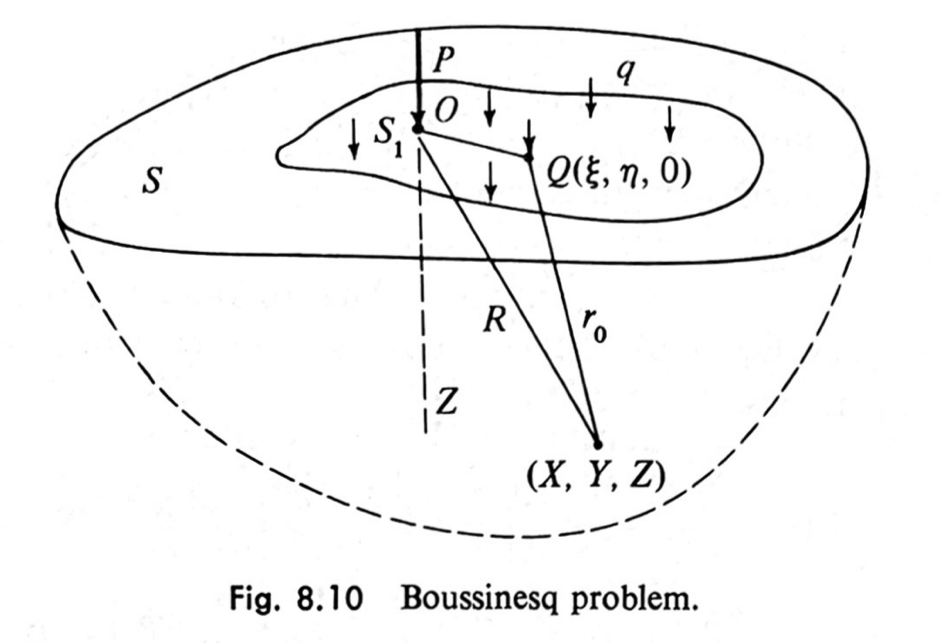
Consider a linearly elastic body with a planar boundary that is infinite in extent below that boundary. Now apply a point load normal to the plane on that boundary:

Figure from Introduction to the Mechanics of a Continuous Medium by Lawrence Malvern
The solution for the vertical stress, , at a depth and a horizontal distance from the point of application of load is
This solution was derived by Joseph Boussinesq in 1885. Geotechnical engineers later found this solution interesting because it gave them an opportunity to calculate subsurface pressures in soil due to the weight of a building founded on that soil. It isn’t perfect because soils aren’t linearly elastic, but it’s a reasonable approach to making estimates, which is what engineering is all about.
Now, the Boussinesq equation is for a point load, and buildings aren’t points—buildings distribute their weight over their foundation footprint. In theory, this isn’t a problem, because we can handle the distributed load by integration. In practice, it’s a pain in the ass, because the integration has to be done numerically for realistic building footprints and, furthermore, has to be done repeatedly for different depths and different locations under the building. A nonstarter in the pre-computer era.
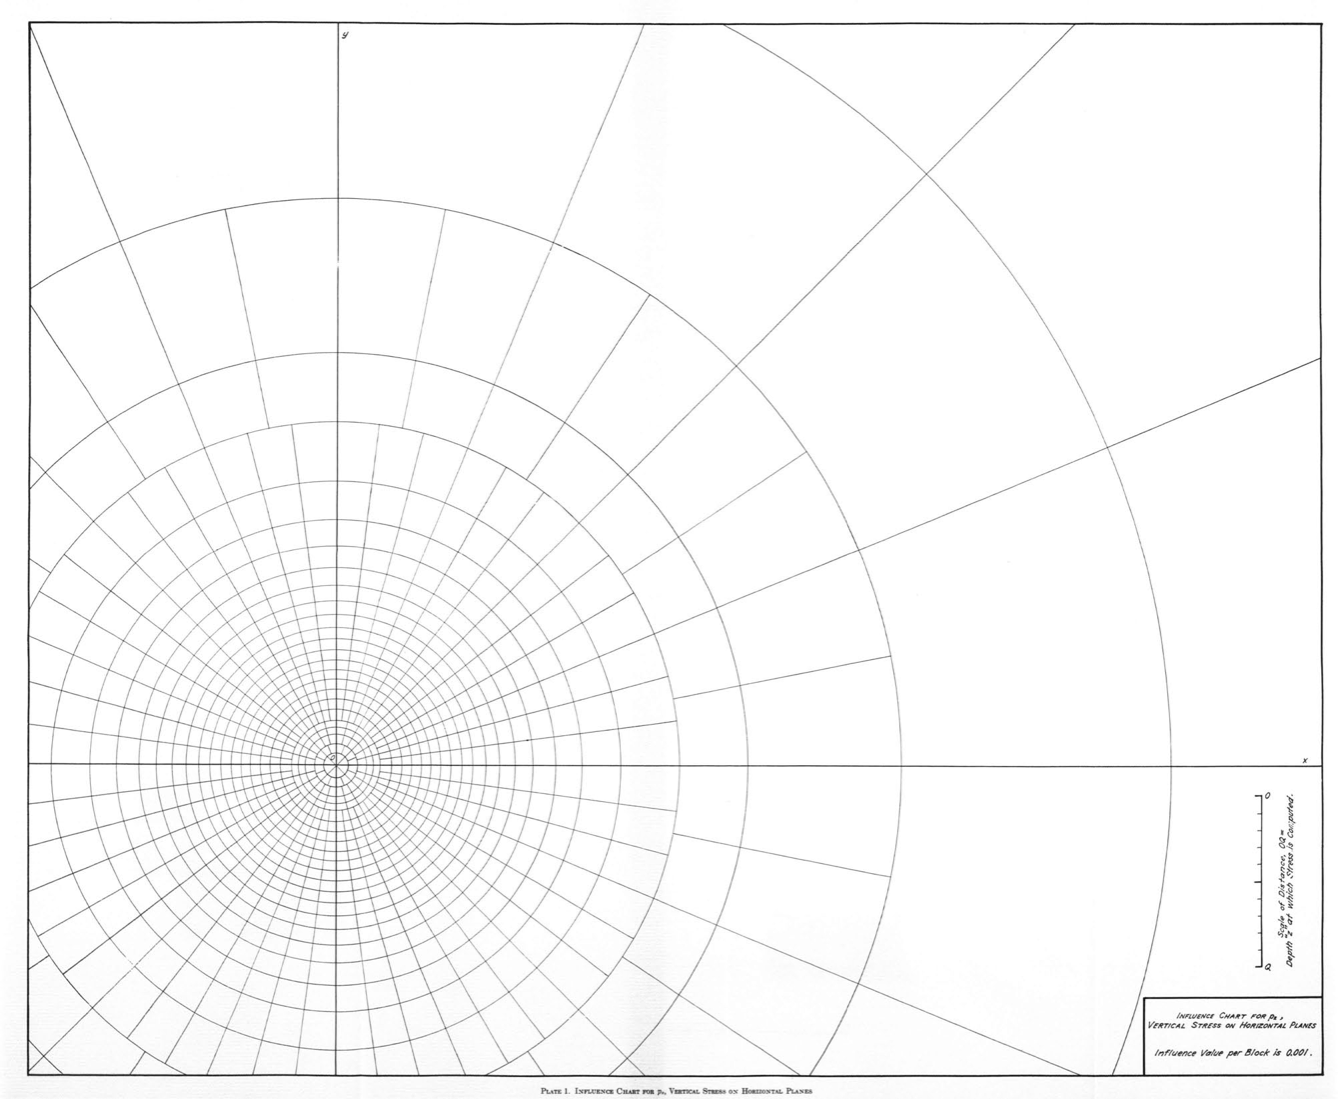
In 1938, Nathan Newmark, then a young professor in the Department of Civil Engineeering at the University of Illinois (my alma mater), came up with a graphical solution to the integration problem. He devised an influence chart that looked like this:

Figure from Engineering Experiment Station Bulletin No. 338
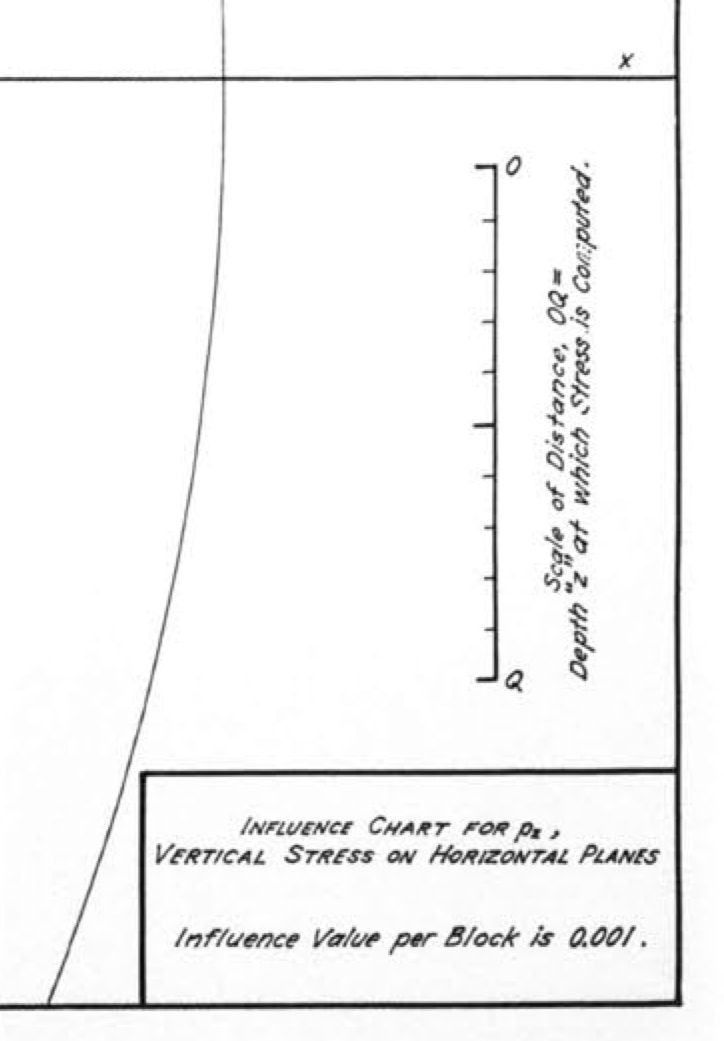
Here’s a more readable view of the scale and other information in the bottom right corner:

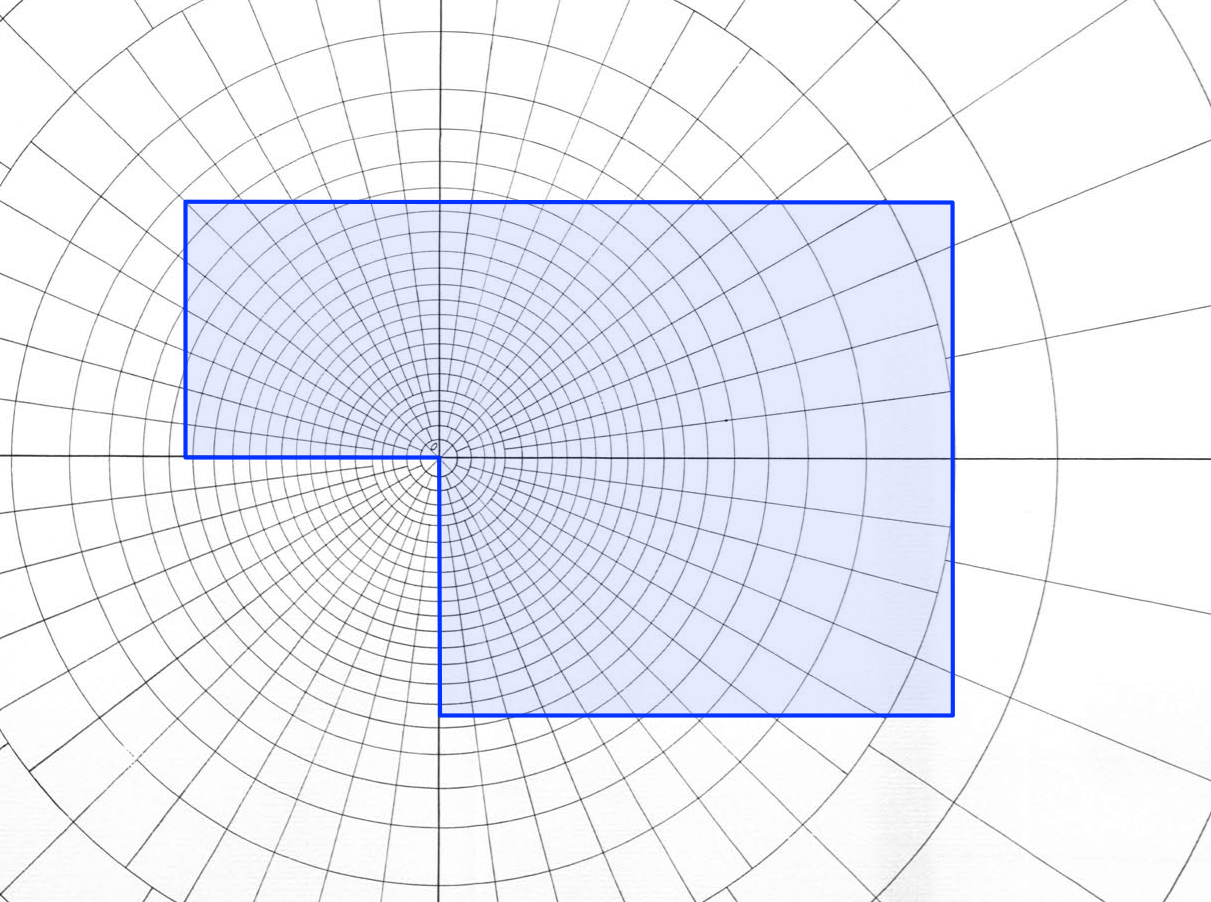
To figure out the vertical pressure in the soil at a given depth, you take that depth to be the distance OQ shown above and draw an outline of the foundation plan to that scale on tracing paper. You then put the drawing on the influence chart and position it so that the horizontal position at which you want the soil pressure is at the center of the chart. For example, if our building plan is a fat ell shape, 50′×75′ with a 25′×25′ chunk taken out of the southwest corner, and we want to calculate the soil pressure under the inside corner at a depth of 25′, we take OQ to be 25′, draw an outline of the building to that scale, and place the drawing with the inside corner at the center of the concentric circles. Like this:

Now we count the number of “squares” the building covers and multiply that by two values:
- The average pressure of the building (its weight divided by the area of its footprint).
- The chart’s influence value of 0.001, which is given in the lower right corner of the chart.
The result is the soil pressure 25′ below the inside corner. To get the pressure at other horizontal positions, we slide the drawing around and count the squares again. To get the pressures at another depth, we redraw the building footprint at a scale appropriate for that depth.1
I’m not saying there isn’t a degree of tedium to this, but it’s a hell of a lot easier than doing multiple numerical integrations on paper with a slide rule and a desk calculator.
The soil pressure influence chart was hardly Newmark’s only contribution to engineering. He was a genius at coming up with alternate ways of seeing problems and devising solution techniques that could be used by everyday engineers working in design offices. Many of these techniques have been superseded by computer-based methods, but at least one—the beta method for structural dynamics problems—is still going strong.
Newmark had moved to emeritus status by the time I was a student; he died during my senior year. The department shut down for a day so the faculty could attend his funeral. Not only had he been their colleague, for many he had been their thesis advisor. This group included my advisor; academically, I am one of Newmark’s many grandchildren.
-
There’s also a pressure component due to the weight of the soil itself, but that’s just the unit weight of the soil multiplied by the depth. Add that to the value calculated via the influence chart to get the total vertical pressure in the soil. ↩
