Building Newmark’s influence chart
April 26, 2024 at 2:03 PM by Dr. Drang
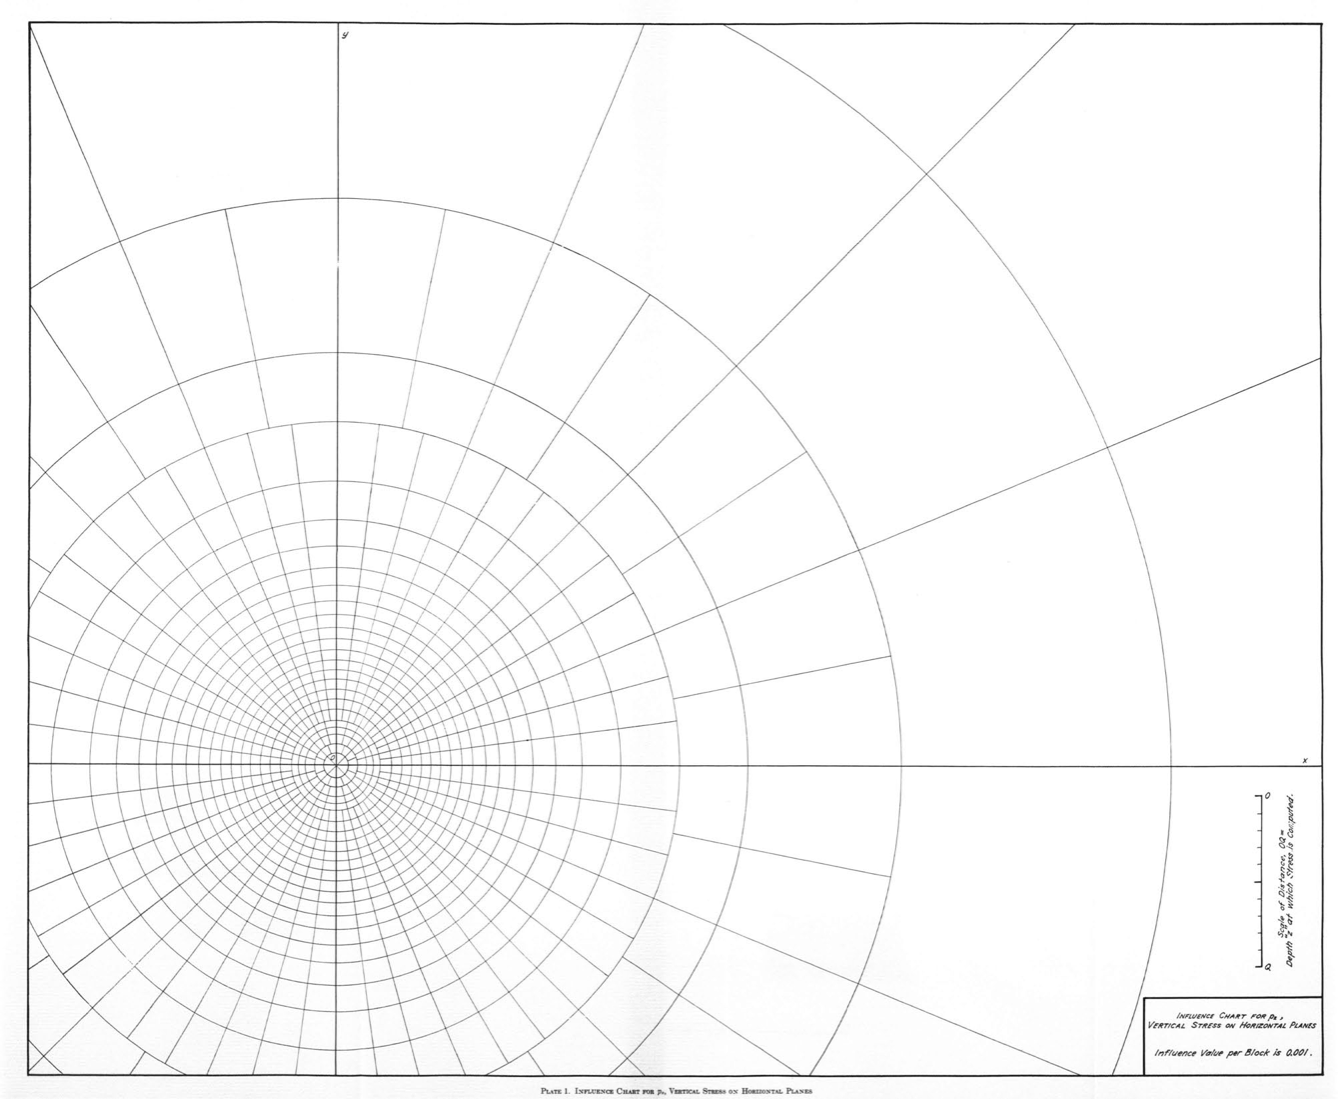
After writing the last post, I decided to do the calculations necessary to make Newmark’s influence chart.

I started with the Boussinesq equation:
If you compare this with the formula I gave last time, you’ll see that I’ve deleted the negative sign. That’s because tensile stresses seldom arise in soil mechanics, so the convention is to take compressive stresses as positive.
This is a solution to the elasticity equations in cylindrical coordinates, , where the origin of the coordinate system is at the point on the surface where the load is applied. Notice that there’s a circular symmetry to the solution— is independent of the angle .
This symmetry has an interesting and very useful consequence. We can move the origin of the coordinate system to the point on the surface above the point at which we are calculating the stress, and the formula for will remain the same. We’ll use this to figure out the stress1 associated with a distributed load.
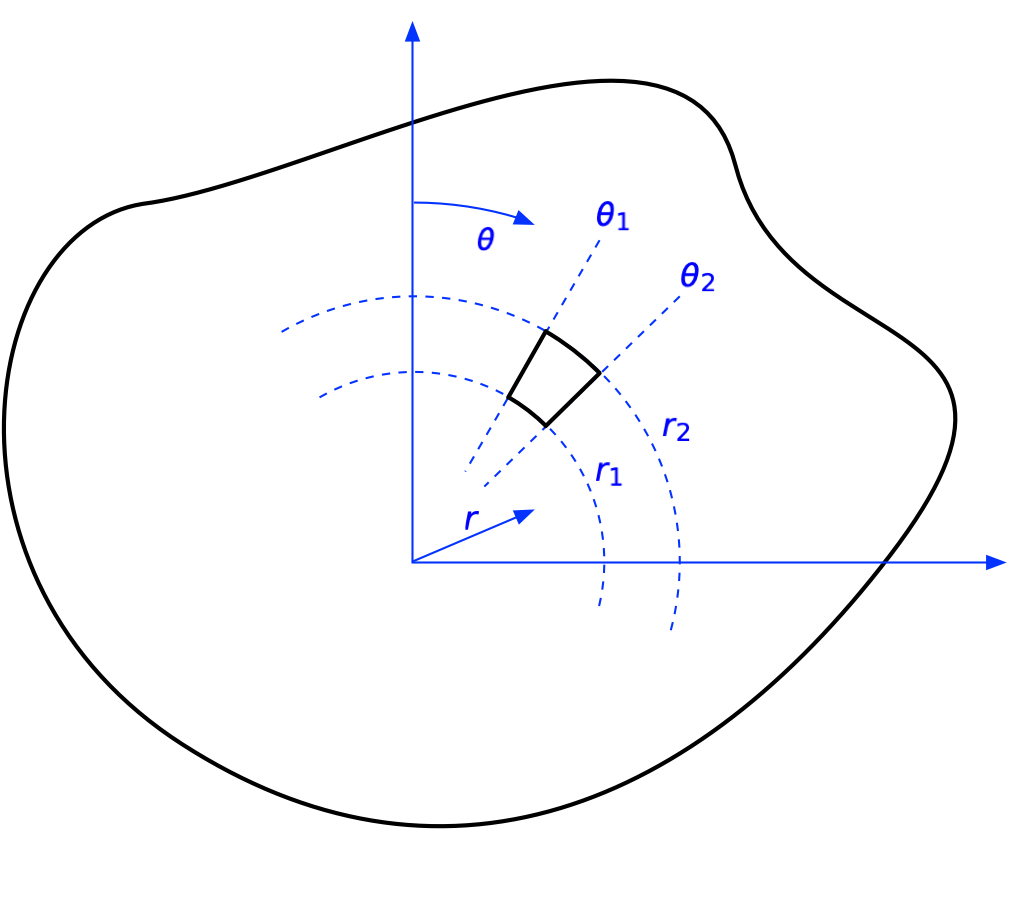
Because Newmark has made his chart as a series of rings split into sectors, we’re going to calculate the stress due to a uniform distributed load, , acting over one of these sectors. The two radii that bound the sector are and , and the two angles that bound the sector are and .
 With this loaded area defined, we can write the resulting stress as
Because the integrand doesn’t contain , that part of the integral will result in a term, which we’ll call . That term, along with the constants, can be brought outside the integral over :
If there were an analytical solution to this integral, we’d be in business, but I don’t think there is. I gave the problem to Mathematica, and it thought for over five minutes without coming up with an answer before I stopped it. So we’re going to have to use numerical integration, which means it’s time to nondimensionalize the equation.
First, we note that is nondimensional. This fits in with Newmark’s scheme, because this is what he calls the influence value (see the lower right corner of the chart). So we know this term is going to be 0.001.
Second, we see that Newmark split each ring into an integral number of sectors. The number of sectors isn’t the same for each ring, but we can always say that
where is a positive integer. Therefore,
Finally, we note that Newmark scales the radii of the rings by the depth, . So we’ll define a new variable, , and rewrite the integral using this change of variable. We see that
and (this may not be as obvious, but you can check it)
So with these substitutions, we get
Hey, look! The ’s all cancel out, and we’re left with
Note that all the terms in this equation are pure numbers; none of them have any units, like feet or meters or pounds. That’s what I meant by “nondimensionalize.”
So now all we have to do is find a sequence of values for and that will solve this equation for the appropriate value of . Starting at the origin of the chart, we know that and (you may have to zoom in to see that), and we can solve for . Then for the next ring, we use the previously calculated value of as our new value for and set . This continues on for all 25 rings in the chart.
The box below should contain the Mathematica notebook I used to do the calculations. If it’s empty, that means the Wolfram Cloud is being slow and stubborn, so you might have better luck following this link. Or not. I don’t have a lot of experience with the Wolfram Cloud, but so far I’ve noticed that it isn’t as responsive as the documentation would have you believe.
Whether you have any experience with Mathematica or not, I think the logic of the notebook is relatively easy to follow. For each pass through the Do loop, we’re calculating a new upper limit for the numerical integral that solves the equation. That value is then appended to the list of radii and gets used as the lower limit of the numerical integration during the next loop. Finally, the ring thicknesses are calculated by subtraction.
The results are summarized in this table:
| Ring | Sectors | Outer radius | Thickness |
|---|---|---|---|
| 1 | 8 | 0.07327 | 0.07327 |
| 2 | 16 | 0.12778 | 0.05450 |
| 3 | 24 | 0.18259 | 0.05481 |
| 4 | 24 | 0.22600 | 0.04342 |
| 5 | 24 | 0.26382 | 0.03781 |
| 6 | 48 | 0.33048 | 0.06667 |
| 7 | 48 | 0.39080 | 0.06032 |
| 8 | 48 | 0.44807 | 0.05727 |
| 9 | 48 | 0.50413 | 0.05606 |
| 10 | 48 | 0.56025 | 0.05612 |
| 11 | 48 | 0.61747 | 0.05723 |
| 12 | 48 | 0.67678 | 0.05931 |
| 13 | 48 | 0.73921 | 0.06243 |
| 14 | 48 | 0.80596 | 0.06675 |
| 15 | 48 | 0.87854 | 0.07258 |
| 16 | 48 | 0.95895 | 0.08041 |
| 17 | 48 | 1.05003 | 0.09108 |
| 18 | 48 | 1.15606 | 0.10603 |
| 19 | 48 | 1.28396 | 0.12790 |
| 20 | 48 | 1.44608 | 0.16213 |
| 21 | 48 | 1.66772 | 0.22164 |
| 22 | 48 | 2.01358 | 0.34586 |
| 23 | 32 | 2.41493 | 0.40135 |
| 24 | 32 | 3.31945 | 0.90452 |
| 25 | 16 | 4.89898 | 1.57953 |
The inner radius of each ring is the outer radius of the ring before it. The exception is the first ring; recall that its inner radius is zero.
My first thought after running out these calculations was to check the numbers against measurements I could take from the chart. They were pretty close. Not perfect, but typically within a couple of percent. I couldn’t really expect any better, as the chart (which is a page from this PDF) wasn’t scanned at a particularly high resolution (only 150 dpi), and it wasn’t perfectly aligned with the scanner (the horizontal axis isn’t quite horizontal).
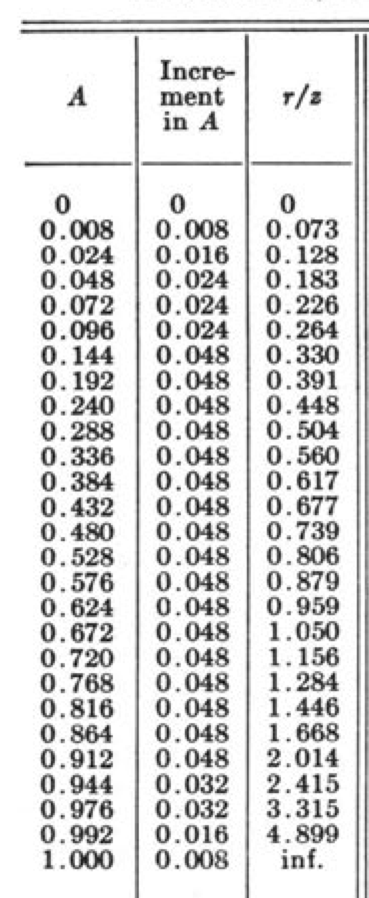
But would Newmark include a chart without giving the data necessary for readers to reproduce it? Of course not. In the appendix is a table of values for making all the various influence charts discussed in the paper.2 Here’s an excerpt from the table that shows the ring radii for the vertical pressure influence chart.

It’s the third column, which gives the radius as a fraction of the depth, , that we can compare to the “Outer radius” column in the table above. As you can see, all the numbers match to three decimal places except the one for the 24th ring. Newmark shows 3.315, when the value should be 3.319. Should we blame the student who did the calculations, noted in the acknowledgments as Harold Crate? Should we blame the unacknowledged secretary who typed up Crate’s calculations? No, we have to blame Nate Newmark himself—after all, he’s the guy whose name is mentioned in all the soil mechanics textbooks.
-
If you haven’t noticed yet, I’m using the words, stress and pressure interchangeably because for this problem they are the same when I’m talking about what’s going on at depth in the soil. ↩
-
I’ve only discussed the chart for vertical pressure, but Newmark also provides charts for shear stresses, maximum principal stress, and so on. ↩
