Semi-automated plotting
November 6, 2024 at 11:18 PM by Dr. Drang
The Matplotlib code in the last post was initially generated with a Typinator abbreviation that I tweaked to make the final script. After writing the post, I decided it would be nice to have a second, similar abbreviation. This post shows you both.
Typinator is like its more well-known competitor, TextExpander, except it hasn’t shifted its focus to “the enterprise,” doesn’t require a subscription, and doesn’t advertise on podcasts. Although the abbreviations discussed here are built for Typinator, they could be easily adapted to TextExpander, TypeIt4Me, or Keyboard Maestro. (Keyboard Maestro isn’t, strictly speaking, an abbreviation utility, but it can be used as one. In fact, the first abbreviation we’ll see started life as a Keyboard Maestro macro.)
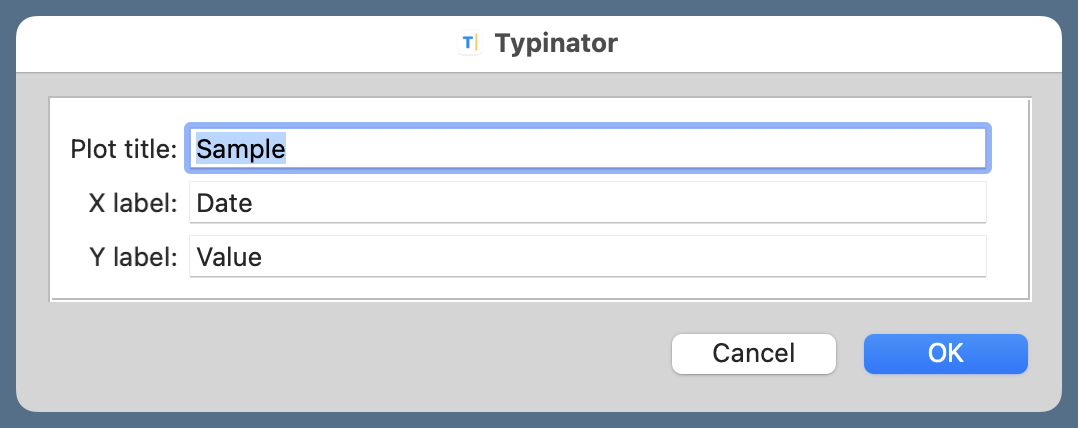
For several years I’ve had an abbreviation1 called ;plot, which, when invoked, brings up a little window that looks like this:

After you enter the title and axis labels, it inserts the following text:
python:
 1:  #!/usr/bin/env python3
 2:
 3:  import matplotlib.pyplot as plt
 4:  from matplotlib.ticker import MultipleLocator, AutoMinorLocator
 5:
 6:  # Create the plot with a given size in inches
 7:  fig, ax = plt.subplots(figsize=(6, 4))
 8:
 9:  # Add a line
10:  ax.plot(x, y, '-', color='blue', lw=2, label='Item one')
11:
12:  # Set the limits
13:  # plt.xlim(xmin=0, xmax=100)
14:  # plt.ylim(ymin=0, ymax=50)
15:
16:  # Set the major and minor ticks and add a grid
17:  # ax.xaxis.set_major_locator(MultipleLocator(20))
18:  # ax.xaxis.set_minor_locator(AutoMinorLocator(2))
19:  # ax.yaxis.set_major_locator(MultipleLocator(10))
20:  # ax.yaxis.set_minor_locator(AutoMinorLocator(5))
21:  # ax.grid(linewidth=.5, axis='x', which='major', color='#dddddd', linestyle='-')
22:  # ax.grid(linewidth=.5, axis='y', which='major', color='#dddddd', linestyle='-')
23:
24:  # Title and axis labels
25:  plt.title('Sample')
26:  plt.xlabel('Date')
27:  plt.ylabel('Value')
28:
29:  # Make the border and tick marks 0.5 points wide
30:  [ i.set_linewidth(0.5) for i in ax.spines.values() ]
31:  ax.tick_params(which='both', width=.5)
32:
33:  # Add the legend
34:  # ax.legend()
35:
36:  # Save as PDF
37:  plt.savefig('20241106-Sample.pdf', format='pdf')
This is not quite a full program for producing a graph—the x and y data aren’t defined—but it’s a good start. You’ll note that the items we entered in the input fields show up in Lines 25–27 and 37.
Much of the code is commented out. As I said in the previous post, Matplotlib has decent defaults for many graph features, but I usually like to customize some of them. The commented code is there to remind me of the functions that are needed for some common customizations. I uncomment the lines for the things I want to customize and adjust the function parameters as needed.
The abbreviation is defined with this as the text that replaces ;plot:
 1:  #!/usr/bin/env python3
 2:
 3:  import matplotlib.pyplot as plt
 4:  from matplotlib.ticker import MultipleLocator, AutoMinorLocator
 5:
 6:  # Create the plot with a given size in inches
 7:  fig, ax = plt.subplots(figsize=(6, 4))
 8:
 9:  # Add a line
10:  ax.plot(x, y, '-', color='blue', lw=2, label='Item one')
11:
12:  # Set the limits
13:  # plt.xlim(xmin=0, xmax=100)
14:  # plt.ylim(ymin=0, ymax=50)
15:
16:  # Set the major and minor ticks and add a grid
17:  # ax.xaxis.set_major_locator(MultipleLocator(20))
18:  # ax.xaxis.set_minor_locator(AutoMinorLocator(2))
19:  # ax.yaxis.set_major_locator(MultipleLocator(10))
20:  # ax.yaxis.set_minor_locator(AutoMinorLocator(5))
21:  # ax.grid(linewidth=.5, axis='x', which='major', color='#dddddd', linestyle='-')
22:  # ax.grid(linewidth=.5, axis='y', which='major', color='#dddddd', linestyle='-')
23:
24:  # Title and axis labels
25:  plt.title('{{?Plot title}}')
26:  plt.xlabel('{{?X label}}')
27:  plt.ylabel('{{?Y label}}')
28:
29:  # Make the border and tick marks 0.5 points wide
30:  [ i.set_linewidth(0.5) for i in ax.spines.values() ]
31:  ax.tick_params(which='both', width=.5)
32:
33:  # Add the legend
34:  # ax.legend()
35:
36:  # Save as PDF
37:  plt.savefig('{YYYY}{MM}{DD}-{{?Plot title}}.pdf', format='pdf')
Virtually all the text is expanded verbatim. The exceptions are the plot title and axis labels in Lines 25–27 and the filename in Line 37. As you can see, Typinator uses special codes with curly braces to insert the non-verbatim material. For example
{{?Plot title}}
in Lines 25 and 37 tells Typinator to ask for input and inserts the text provided in the field. Similarly
{YYYY}{MM}{DD}
in Line 37 inserts the four-digit year, the two-digit month, and the two-digit day. The last two will have leading zeros, if necessary.
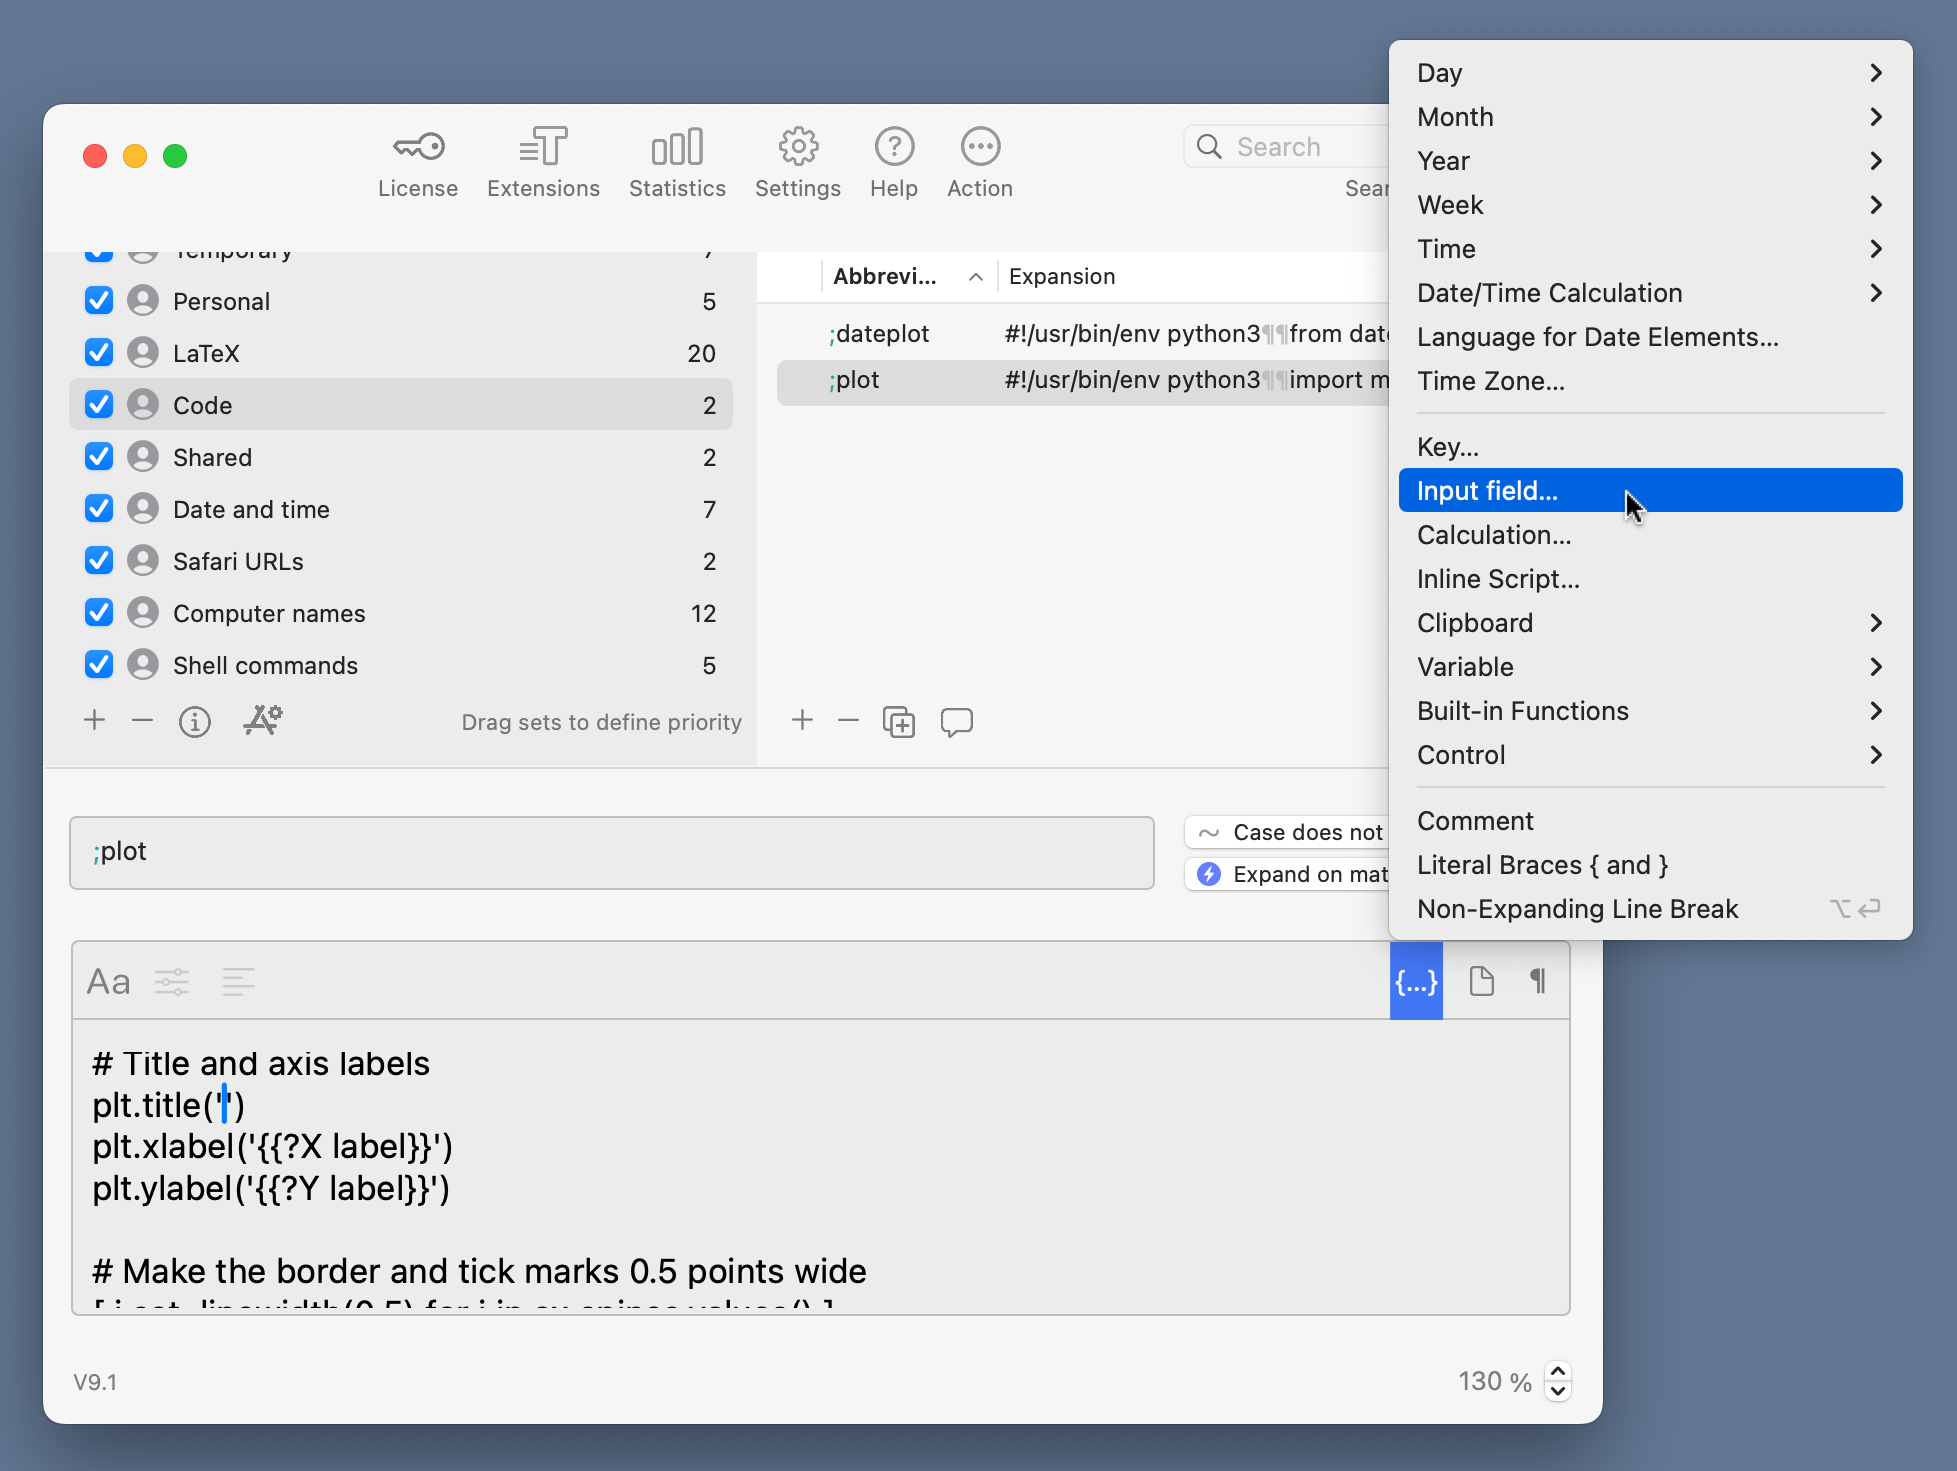
You don’t have to remember the special curly brace syntax. When you’re defining an abbreviation, Typinator lets you choose the special marker code from a popup menu.

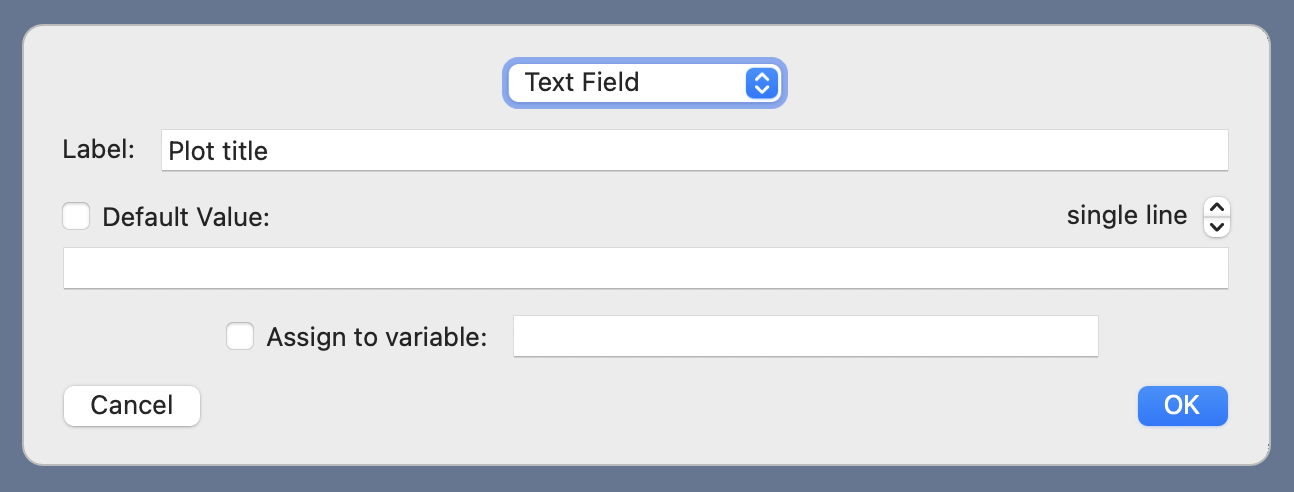
As you can see, there are submenus for the various date and time formats. When you choose an input field, you get this dialog to define the input and what kind of data it can hold:

Note that there’s a way to define a default value. That can be helpful in filling out the input fields quickly. What’s also helpful is that if a field doesn’t have a default value, Typinator remembers what you entered the last time the abbreviation was used and opens the input window with those values in the appropriate fields.
Although ;plot was helpful in writing the code for the last post, I realized when I was done with all the customizations that it wasn’t especially helpful with the x-axis. Matplotlib has different functions for customizing a date and time axis, and none of those functions are in ;plot.
I thought about adding commented-out lines with date and time functions to ;plot, but decided it would be cleaner to have a completely different abbreviation, ;dateplot, for date and time series plotting. Here’s its definition:
 1:  #!/usr/bin/env python3
 2:
 3:  from datetime import datetime
 4:  import matplotlib.pyplot as plt
 5:  from matplotlib.ticker import MultipleLocator, AutoMinorLocator
 6:  from matplotlib.dates import DateFormatter, YearLocator, MonthLocator
 7:
 8:  # Create the plot with a given size in inches
 9:  fig, ax = plt.subplots(figsize=(6, 4))
10:
11:  # Add a line
12:  ax.plot(x, y, '-', color='blue', lw=2, label='Item one')
13:
14:  # Set the limits
15:  # plt.xlim(xmin=datetime(2010,1,1), xmax=datetime(2016,1,1))
16:  # plt.ylim(ymin=0, ymax=50)
17:
18:  # Set the major and minor ticks and add a grid
19:  # ax.xaxis.set_major_locator(YearLocator(1))
20:  # ax.xaxis.set_minor_locator(MonthLocator())
21:  # ax.xaxis.set_major_formatter(DateFormatter('%-m/%Y'))
22:  # ax.yaxis.set_major_locator(MultipleLocator(10))
23:  # ax.yaxis.set_minor_locator(AutoMinorLocator(5))
24:  # ax.grid(linewidth=.5, axis='x', which='major', color='#dddddd', linestyle='-')
25:  # ax.grid(linewidth=.5, axis='y', which='major', color='#dddddd', linestyle='-')
26:
27:  # Title and axis labels
28:  plt.title('{{?Plot title}}')
29:  plt.xlabel('{{?X label}}')
30:  plt.ylabel('{{?Y label}}')
31:
32:  # Make the border and tick marks 0.5 points wide
33:  [ i.set_linewidth(0.5) for i in ax.spines.values() ]
34:  ax.tick_params(which='both', width=.5)
35:
36:  # Add the legend
37:  # ax.legend()
38:
39:  # Save as PDF
40:  plt.savefig('{YYYY}{MM}{DD}-{{?Plot title}}.pdf', format='pdf')
It imports a few more libraries near the top, uses datetime data to define the x-axis limits on Line 15, and has date-related functions in the code on Lines 19–21 for customizing the x-axis ticks and tick labels. Otherwise, it’s the same as ;plot.
With this new abbreviation, I should be able to build time series graphs more quickly than before.
-
You may know them as “snippets,” because that’s the term TextExpander uses. Typinator uses “abbreviations,” so that’s what I’ll call them. ↩
