Mind your plotting
December 29, 2024 at 12:46 PM by Dr. Drang
A couple of weeks ago, Presh Talwalkar released this Mind Your Decisions video in which his original attempt to solve the video’s puzzle was, he says, incomplete because he was led astray by plotting the function at the heart of the problem. I say he didn’t do enough plotting.
Here’s the video,
The goal is to solve this equation:
There are five values of x that solve it.
Presh plotted the function via Desmos, an online graphing calculator I wasn’t familiar with. Here’s what he got:
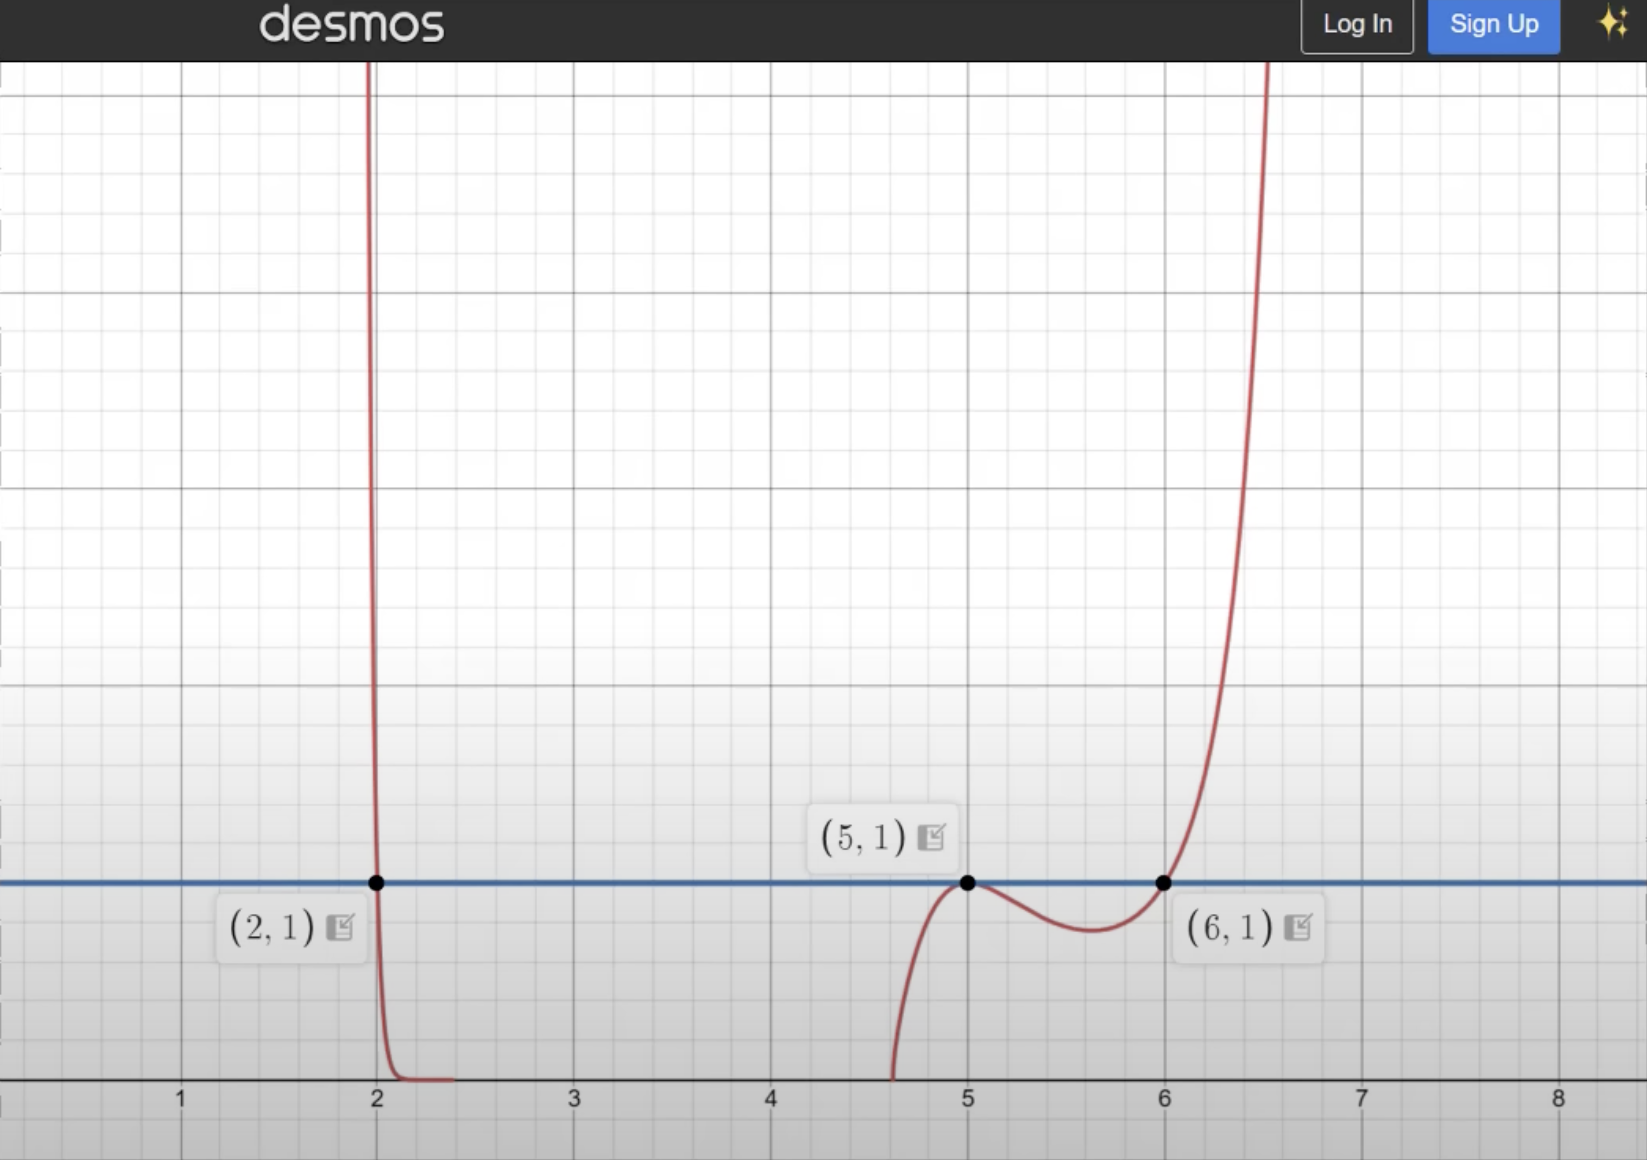
He found three solutions this way: , , and . These are all correct, but he’s missing two. So he abandoned plotting and went about the solution algebraically.
What he could have done was look at this plot more critically. What’s going on between about 2½ and 4½? At first, I thought Desmos had been set up to not show values below the x-axis, but that’s not what was happening. More plotting will give us the answer.
Going back to the beginning, our function is
and we want to find the values of x for which .
Let’s look at the base,
and exponent,
separately and see how they behave. After plotting ,
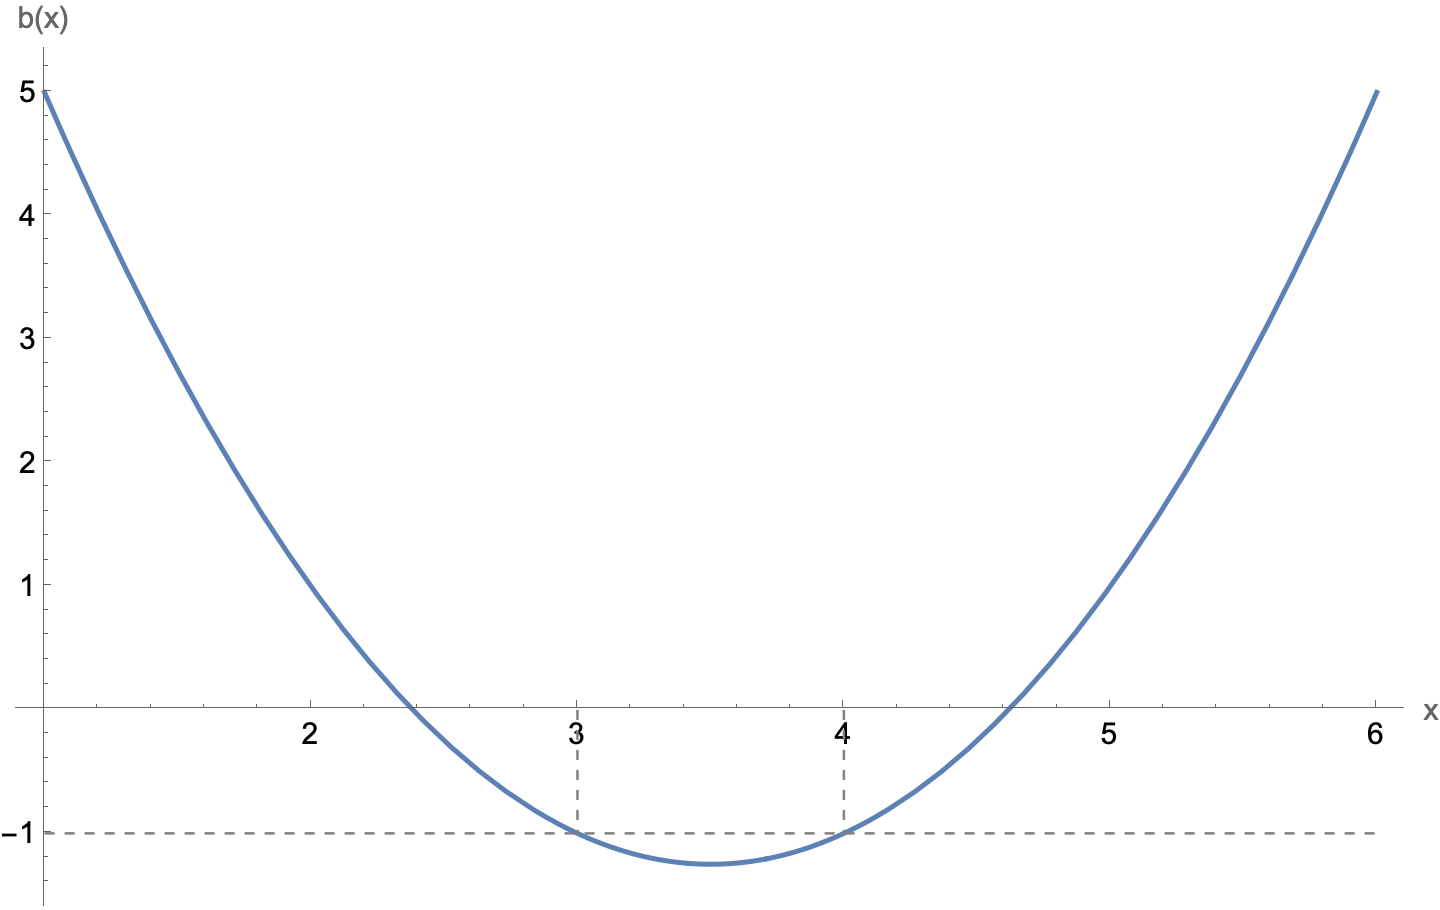
it’s clear why Desmos wasn’t plotting between about 2.4 and 4.6: is negative and therefore will be complex almost everywhere in that interval. But because of the way this puzzle has been constructed, there are a couple of important exceptions.
Note in the plot above that at and . That means that at these points if the exponent, , is a positive even integer for those same values of (Presh discusses this in the algebraic part of the video). Let’s plot :
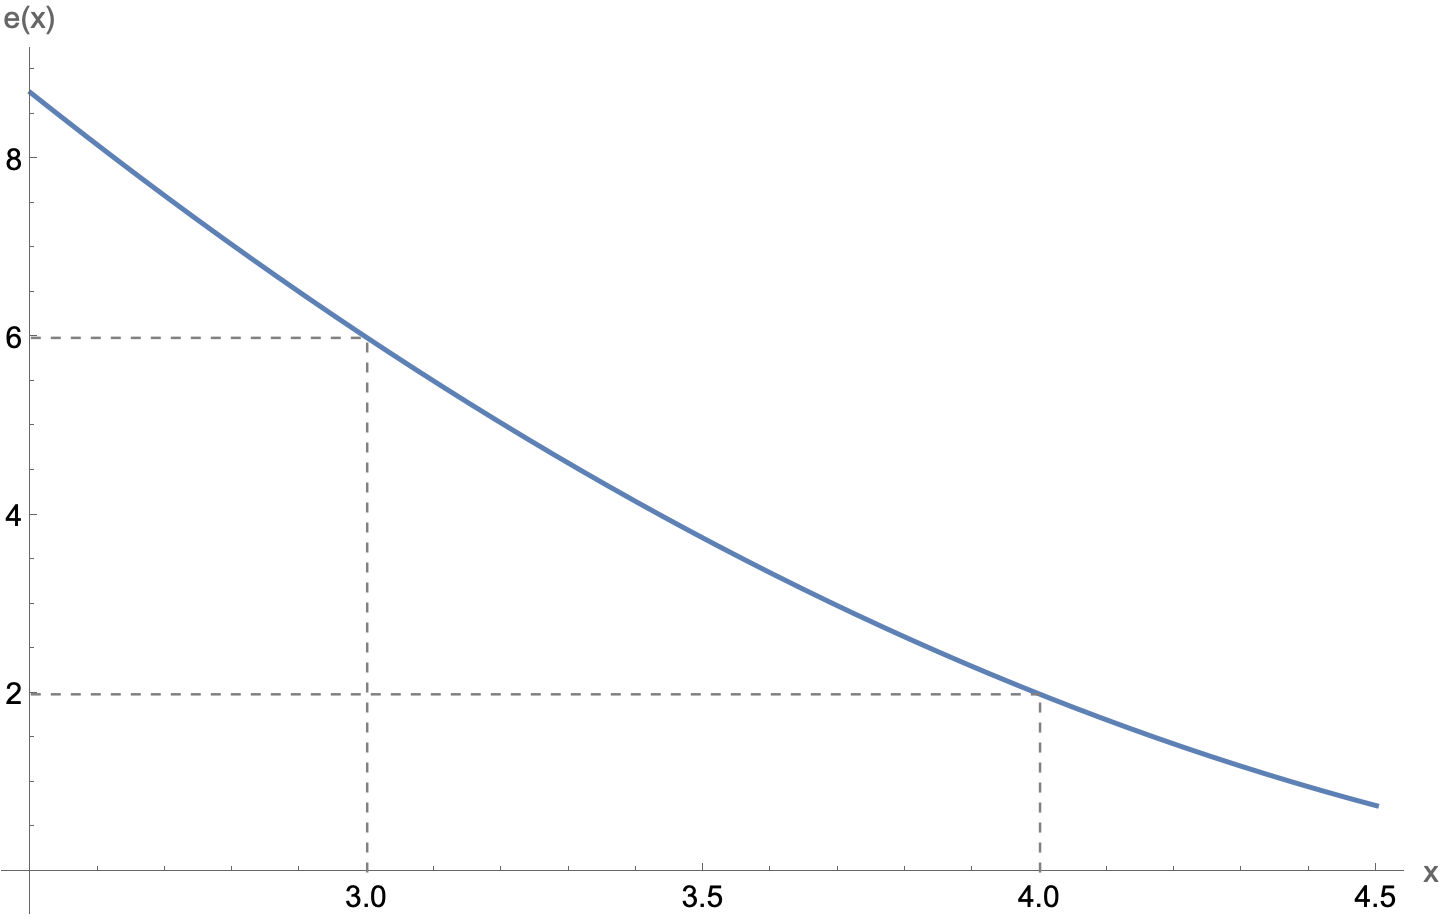
Well, whaddaya know! The exponent is an even number at both of those values, giving us our other two solutions. This is what makes the puzzle so clever.
But why did Desmos fail to plot these two points? They are, after all, real values and can be plotted. And Desmos isn’t unique in this regard. I asked Mathematica to do the same plot, and it returned basically the same graph:
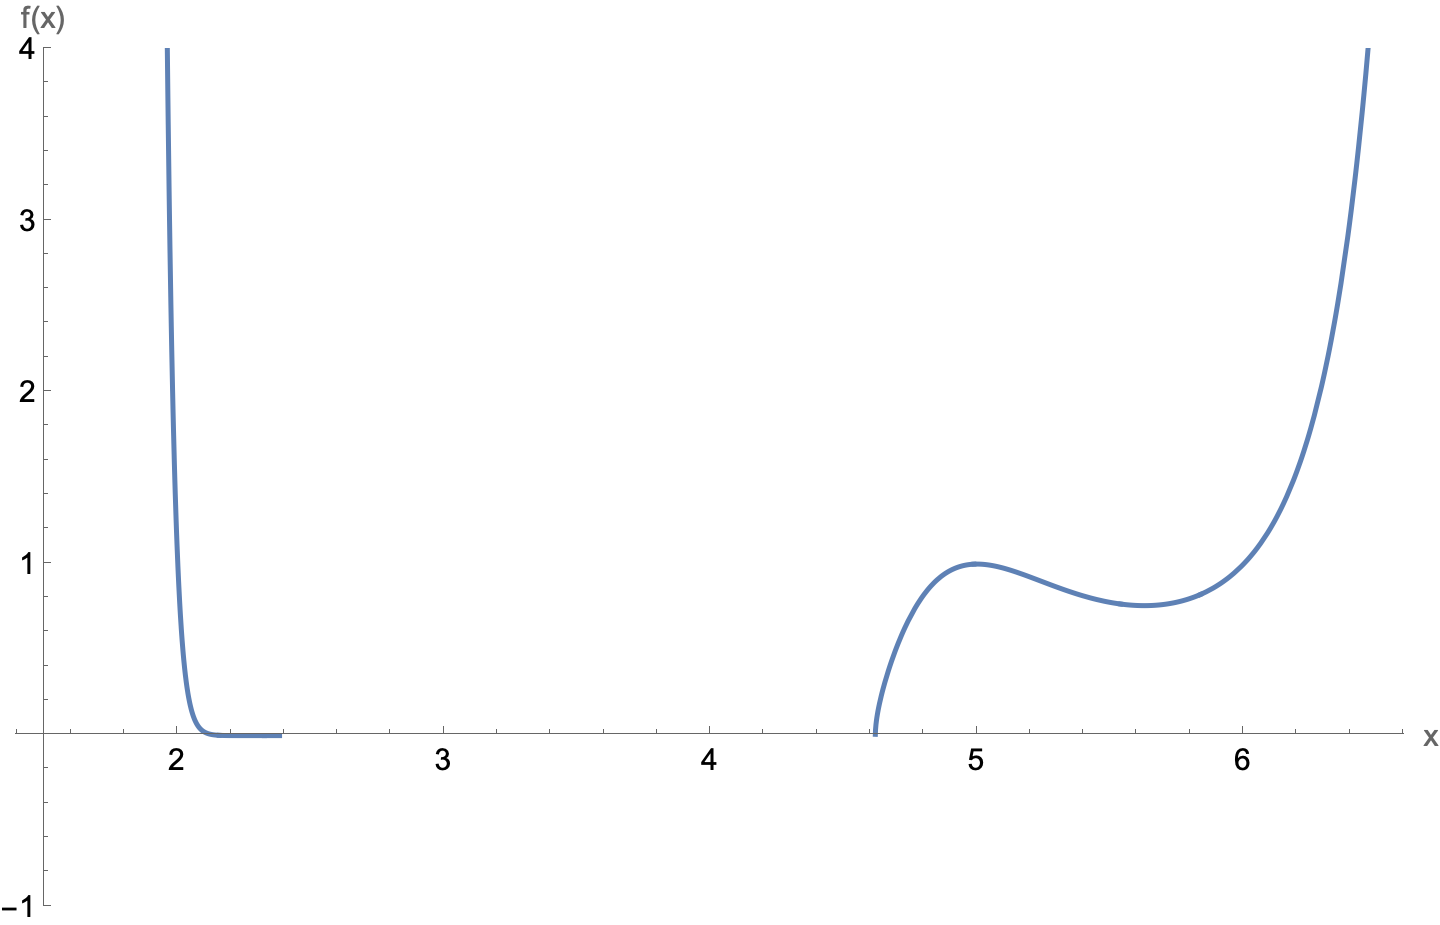
Nothing in that middle interval, even though two points in there have values that are real.
I can think of a couple of possible reasons for this:
- Both Desmos and Mathematica use the equation to generate a series of points and draw short lines between all those points. If the points and are missed in the generation, then there’s no way they can be plotted.
- Even if and are generated, the points adjacent to them will have a complex y value, and you can’t draw a line between a real- and complex-valued point.
To test the second possibility in Mathematica, I made this little notebook:
It creates a table of pairs whose values are equally spaced apart and whose values are determined by . The ListPlot graph is of the points themselves, and we see that both and show up because they’re in the table of points. The other points in that middle interval aren’t plotted because their values are complex. On the other hand, the ListLinePlot graph doesn’t show or because (I think) the adjacent points can’t be plotted. This is not a proof of reason #2, but it’s fairly good evidence.
The upshot is that Presh gave up on graphing too soon. If he’d applied the same logic to graphing that he did to his algebraic analysis, he would have come up the the other two solutions, and probably would have done so faster.
Update 29 Dec 2024 6:25 PM
Prompted by longtime online friend mackenab, I made a graph that gives all six solutions at once. Here’s a plot of the magnitude (blue) and phase angle (orange) of vs. .
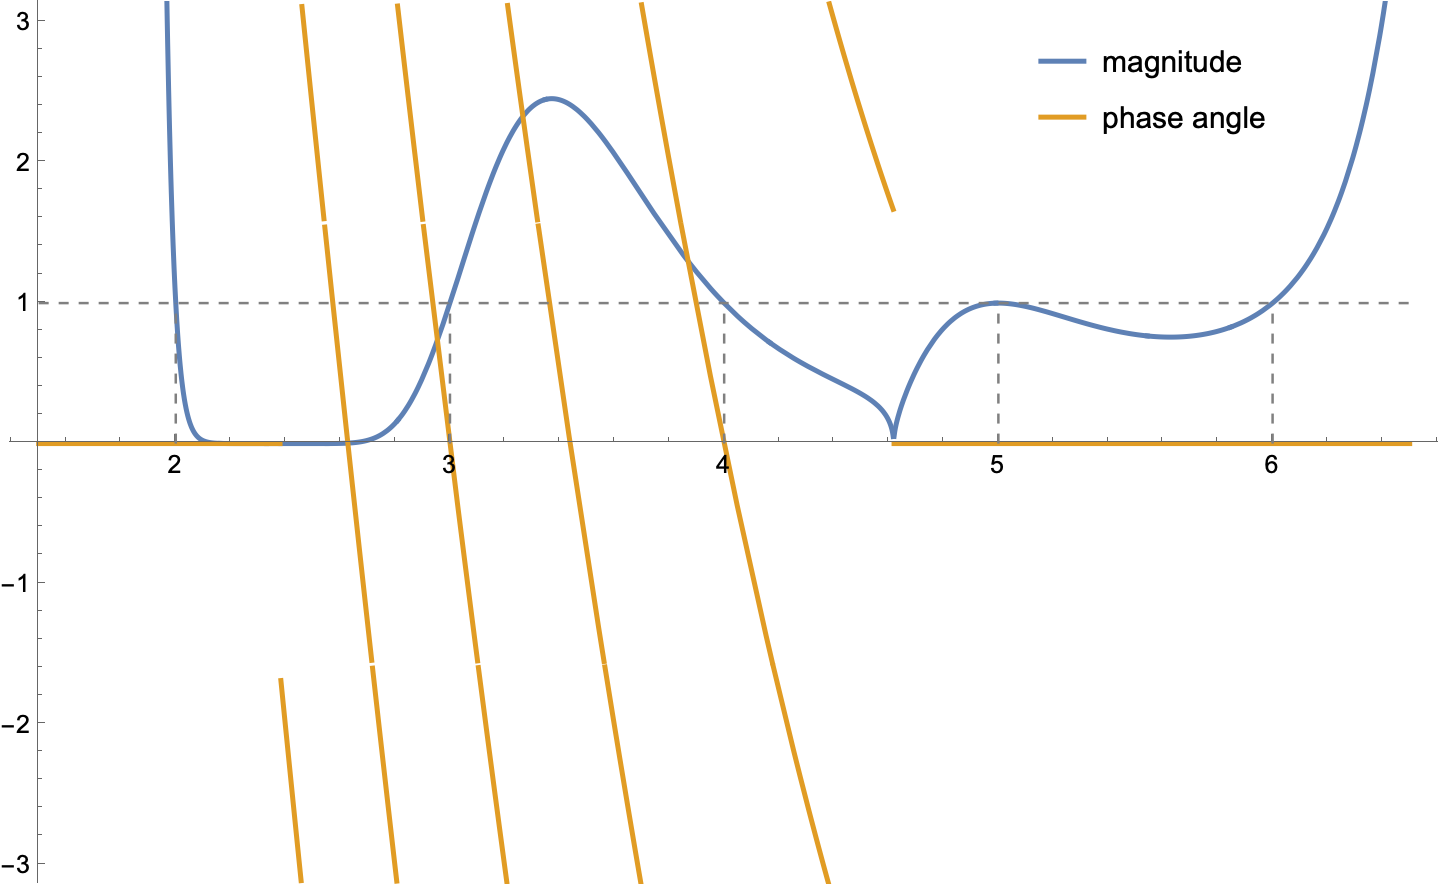
Real solutions of have a magnitude of one and a phase angle of zero. As you can see, values of 2, 3, 4, 5, and 6 give values that meet these criteria.
Magnitude and phase angle come from the Argand diagram representation of a complex number. They’re also known as the absolute value and argument. In Mathematica, this latter terminology is used in the naming of the Abs and Arg functions, which is what I used to make the plot above.
Thanks, Allen!
