Updated Text Tables bundle for TextMate
September 11, 2008 at 10:22 PM by Dr. Drang
In this earlier post, I presented a TextMate bundle with a couple of commands for dealing with tables in PHP Markdown Extra and MultiMarkdown. Today I needed something similar but not quite the same as those commands. I realized that the formatting I wanted was something I need quite often, so I extended my Text Tables bundle to handle a new case.
I did some elementary surveying yesterday (not questionnaire surveying, engineering surveying—like with a transit) and I had a bunch of surface elevation data that I wanted to do a bit of math on (reduce is the term of art) and then plot in Gnuplot. Entering the data and reducing it is really simple in iWork’s Numbers, but Numbers is laughably bad at plotting this kind of data1, so I needed to move the reduced data into a text file where Gnuplot could get at it.
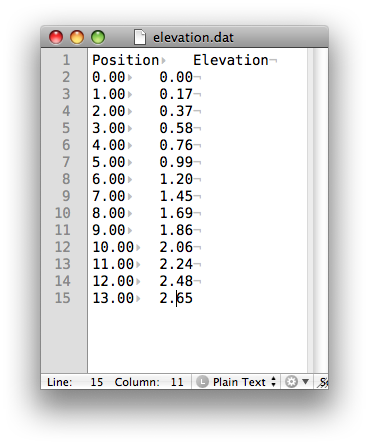
Now I guess Gnuplot could handle the tab-separated values that I’d get from copying a Numbers table and pasting it into a TextMate document, but I hate having tabs in my files, and I wanted all the data to line up nicely. So I modified the Python script that aligned Markdown tables to put the data in a form that looks nice and is readable by Gnuplot. It takes data that looks like this

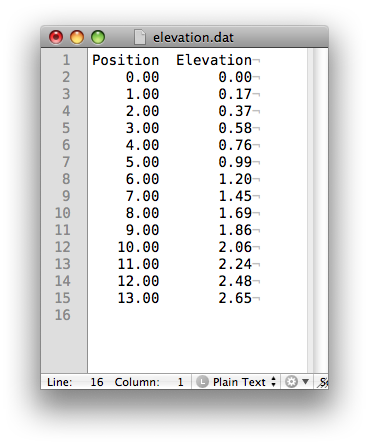
and turns it into this

I have TextMate’s Show Invisibles turned on in these screenshots so you can see where the tab characters are in the original.
Here’s the script:
 1:  #!/usr/bin/python
 2:
 3:  import sys
 4:
 5:  def normtable(text):
 6:      "Right-aligns columns in a tab-separated text table."
 7:
 8:      # Start by turning the text into a list of lines.
 9:      lines = text.splitlines()
10:      rows = len(lines)
11:
12:      # Extract the content into a matrix.
13:      # Keep track of the number of cells per row.
14:      columns = 0
15:      content = []
16:      for line in lines:
17:          cells = line.split('\t')
18:          if len(cells) > columns: columns = len(cells)
19:          linecontent = [ x.strip() for x in cells ]
20:          content.append(linecontent)
21:
22:      # Append cells to rows that don't have enough.
23:      rows = len(content)
24:      for i in range(rows):
25:          while len(content[i]) < columns:
26:              content[i].append('')
27:
28:      # Get the width of the content in each column.
29:      # The minimum width will be 0.
30:      widths = [0] * columns
31:      for row in content:
32:          for i in range(columns):
33:              widths[i] = max(len(row[i]), widths[i])
34:
35:      # Add whitespace to make all the columns the same width.
36:      # Separate columns with 2 spaces
37:      formatted = []
38:      for row in content:
39:          formatted.append('  '.join([ s.rjust(n) for (s, n) in zip(row, widths) ]))
40:
41:      # Return the formatted table.
42:      return '\n'.join(formatted)
43:
44:
45:  # Read the input, process, and print.
46:  unformatted = sys.stdin.read()
47:  print normtable(unformatted)
It’s simpler than the Markdown table formatter because it only does right justification. Apart from a header line or two, the data for Gnuplot will be all numbers. I thought about doing decimal point alignment, but realized that in Numbers each column of data will almost always be formatted to a fixed number of digits after the decimal point; in that case, right alignment is decimal point alignment.
The script is now in the Text Tables bundle as the “Tabs to Gnuplot Table” command. It’s bound to a Key Equivalent of Control-Option-Command-Tab and has a Scope Selector of text. There is a macro in the bundle bound to the same Key Equivalent, but it has a Scope Selector of text.html.markdown, so the two should not interfere.
A zipped version of the Text Tables bundle is here. Unzip it and double-click on it to install.
-
To me, Numbers is laughably bad at plotting everything, but I’m not a pie chart connoisseur. ↩
