OmniGraphSketcher - not yet
December 11, 2011 at 8:50 PM by Dr. Drang
The other day I was listening to the latest Mac Power Users podcast, the one with Horace Dediu as guest,1 and I heard David ask Horace if he used OmniGraphSketcher. I tried out OmniGraphSketcher back in 2009 and decided it wasn’t for me, but I got curious as to whether the things I didn’t like had been reworked in the 2-3 years since then. So I downloaded a trial copy and started playing with it again.
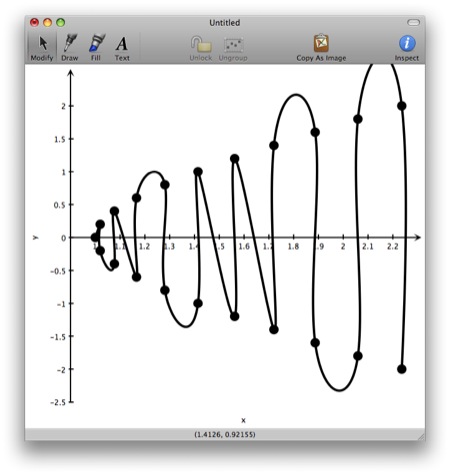
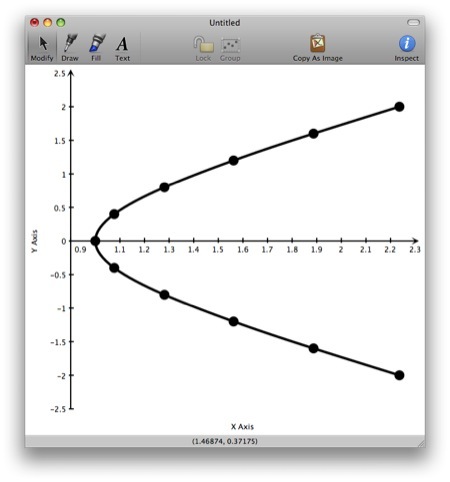
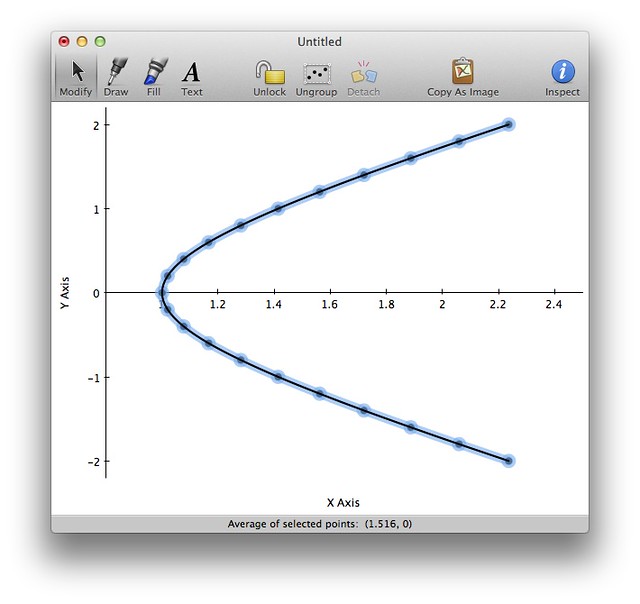
It still isn’t for me. The first problem is that OmniGraphSketcher still connects data points from left to right instead of in the order you give them, just as I found when I first looked into it. So if you generate a set of points to plot the hyperbola , you’ll find that the plot it makes looks like this
instead of this
There is, I found, a way to work around this problem, but it’s easier to just use another charting program. You may think this is no big deal because you don’t plot hyperbolas, but the strict left-to-right connectivity that OmniGraphSketcher imposes screw you up eventually.
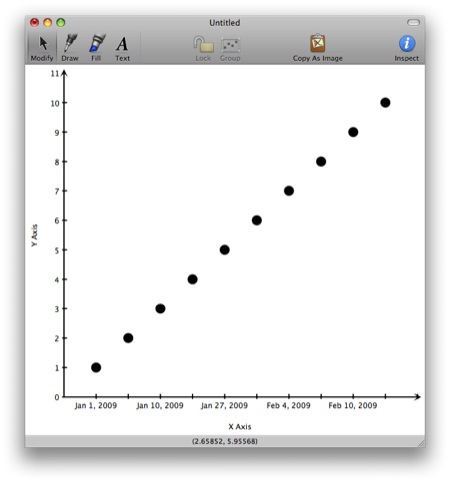
The second problem is that OmniGraphSketcher doesn’t understand dates. If you paste in a time series from a spreadsheet, OmniGraphSketcher will plot the dates along the horizontal axis as if it knows what it’s doing, but if you study the spacing, you’ll see that it’s all messed up.
It’s interpreting the dates as text labels with no numeric value and spacing them uniformly. In the example, the 9 days between January 1 and January 10 takes up the same horizontal distance as the 17 days between January 10 and January 27.
So OmniGraphSketcher is no substitute for a real charting program like Gnuplot. But if you’re not trying to plot real data, but only sketch out—as the name of the app implies—some charts to show generic behavior and trends, OmniGraphSketcher may be worth checking out.
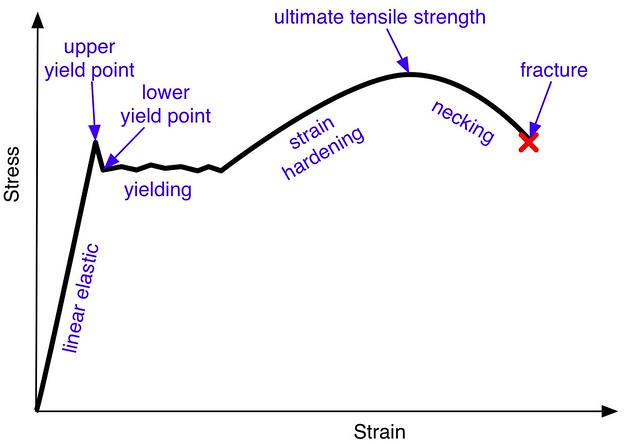
I still prefer OmniGraffle for quick plot sketches, like this generic stress-strain curve for mild steel. It’s probably not as efficient as OmniGraphSketcher for this particular use, but I’ve worked with it enough to get reasonably fast. For me, OmniGraphSketcher would be a waste.
Update (12/12/11)
This update may end up being longer than the original post. Dave from Omni mentioned in the comments that OmniGraphSketcher will connect points in the order you give them (without going through the rigamarole I described here). He’s right, but it’s still easy to get the wrong connection order—easier, I think, than it is to get the right order. Let me explain how it works.
Say you have two columns of numbers you want to plot. We’ll use the right branch of the hyperbola for our example.
| x | y |
|---|---|
| 2.236 | -2.00 |
| 2.059 | -1.80 |
| 1.887 | -1.60 |
| 1.720 | -1.40 |
| 1.562 | -1.20 |
| 1.414 | -1.00 |
| 1.281 | -0.80 |
| 1.166 | -0.60 |
| 1.077 | -0.40 |
| 1.020 | -0.20 |
| 1.000 | 0.00 |
| 1.020 | 0.20 |
| 1.077 | 0.40 |
| 1.166 | 0.60 |
| 1.281 | 0.80 |
| 1.414 | 1.00 |
| 1.562 | 1.20 |
| 1.720 | 1.40 |
| 1.887 | 1.60 |
| 2.059 | 1.80 |
| 2.236 | 2.00 |
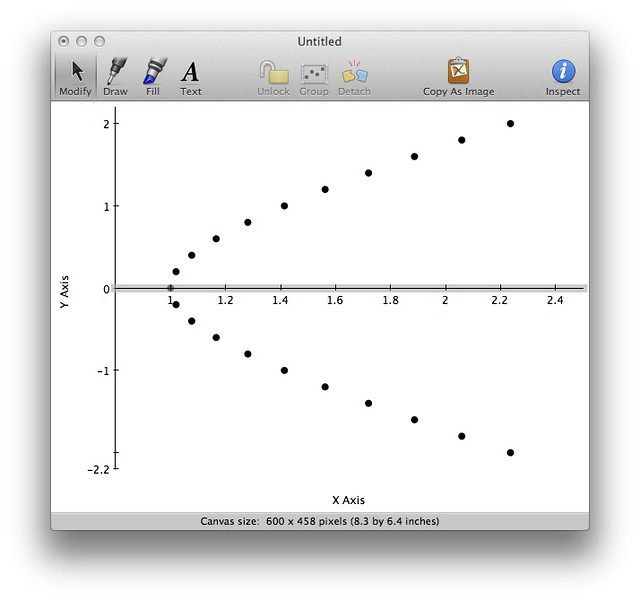
You copy them from whatever application they’re in, open a new OmniGraphSketcher document, and paste. You’ll get a bunch of points, like this:
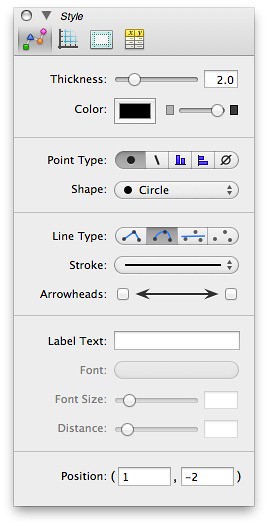
The Style Inspector is where you get to choose the look of the plotted points. Open it up and choose the curvy Line Type
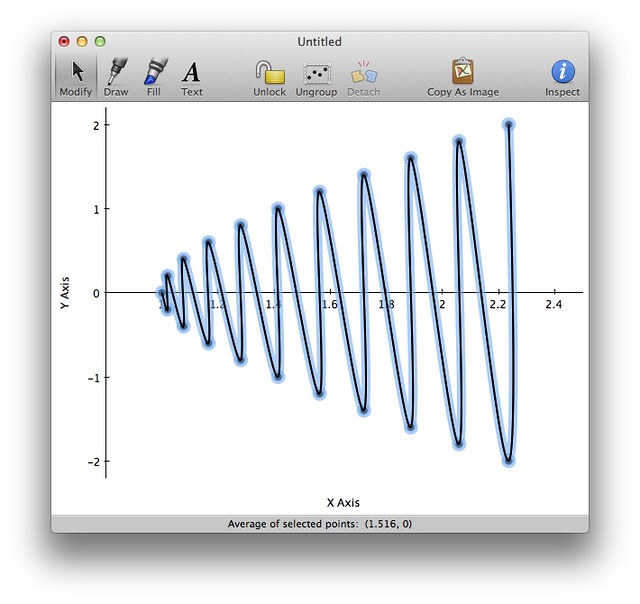
and you’ll get this,
which is disappointing. (The blue halo is there because the plot was selected when I took the screenshot. It’s not part of the plot’s style.)
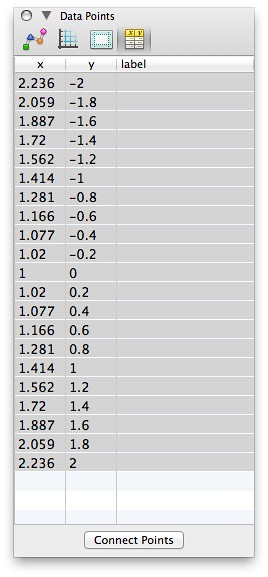
How to get the right connection? Don’t use the Style Inspector to tell it to connect the points. Instead, right after you paste in the points, go to the Data Inspector, which has a table of all the points you pasted in their original order.
Click the Connect Points button at the bottom, and lines will be drawn between the points in the order in which the points are given.
Do you find this intuitive? I don’t. To me, what I did to get the wrong connections was the natural way to use the program. The Style Inspector is where you make all the choices about lines and points—all except this one.
More important, why does OmniGraphSketcher ever connect the points in an order other than the one you give? If I want my data sorted, I’ll do that before plotting, thankyouverymuch. I can’t think of any other plotting programs that work this way. It’s like a word processor automatically alphabetizing your sentences.
That said, at least OmniGraphSketcher does have a way to connect the points in the order you give, which is better than what I thought when I wrote the post yesterday. I still think it’s not for me, but it’s worth a trial if you don’t need it for time series.
-
Overall, I’d say it was a pretty easy show for David and Katie. I’d be surprised if either of them spoke for more than two minutes, total. ↩

