My table problem
March 10, 2017 at 1:01 AM by Dr. Drang
Several years ago, I wrote a series of posts (1, 2, 3, 3.5, 4, and 5) explaining the long evolution of the software tools I use for writing. It started with the Illinois Central Editor (ICE) and RNF on a Cyber 175 mainframe, took a detour through a series of wordprocessors on the Mac (MacWrite to Word to WriteNow to Word to Claris Works), then returned to marked-up plain text with SGML and troff, then LaTeX, then Markdown. I’ve been using this Markdown writing workflow (which still runs through LaTeX to generate the PDF output) for ten or eleven years now, but I’m beginning to think I need to make a change.
The problem is the creation of tables. Because I use MultiMarkdown, and because I’ve written a couple of scripts for handling MultiMarkdown tables, you might think I have a pretty efficient way to add tables to my reports. That’s what I thought, anyway. But over the past few months I’ve been including more tables in my reports and have layout of those tables has often been more complicated than a simple rectangular grid of cells. Row spans, column spans, multiple headers, multiline cells, and oddball alignments have become commonplace, and while MultiMarkdown can handle some of these complexities, too often I’ve had to jump into the generated LaTeX to get the formatting I want.
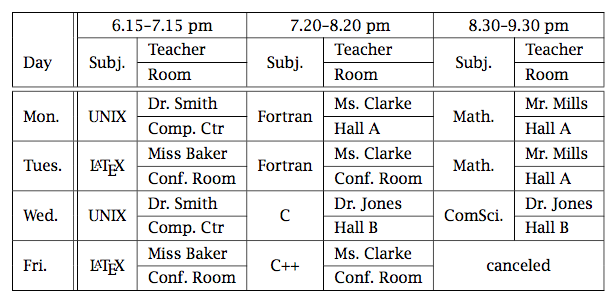
Have you ever written a table in LaTeX? It’s awful. Even if most of the table is already written, I find it very hard to keep track of where I am while editing. There is just so much “noise” in a LaTeX table—ampersands separating cells, double backslashes separating rows, braces if in-cell formatting is needed—it’s hard to focus on the task at hand. And honestly, the default “look” of a LaTeX table is just embarassing. Here’s an example from Kopka and Daly’s Guide to LaTeX:

I avoid most of the ugliness in the output by using the booktabs package, but there’s no way around ugliness in the input. For example, this writeup on the use of booktabs present this nicely laid out table,

but it requires this code to generate,
\usepackage{booktabs}
\newcommand{\ra}[1]{\renewcommand{\arraystretch}{#1}}

\begin{table*}\centering
\ra{1.3}
\begin{tabular}{@{}rrrrcrrrcrrr@{}}\toprule
& \multicolumn{3}{c}{$w = 8$} & \phantom{abc}& \multicolumn{3}{c}{$w = 16$} &
  \phantom{abc} & \multicolumn{3}{c}{$w = 32$}\\ \cmidrule{2-4}
\cmidrule{6-8} \cmidrule{10-12}
  & $t=0$ & $t=1$ & $t=2$ && $t=0$ & $t=1$ & $t=2$ && $t=0$ & $t=1$ & $t=2$\\ \midrule
$dir=1$\\
$c$ & 0.0790 & 0.1692 & 0.2945 && 0.3670 & 0.7187 & 3.1815 && -1.0032 & -1.7104 & -21.7969\\
$c$ & -0.8651& 50.0476& 5.9384&& -9.0714& 297.0923& 46.2143&& 4.3590& 34.5809& 76.9167\\
$c$ & 124.2756& -50.9612& -14.2721&& 128.2265& -630.5455& -381.0930&& -121.0518& -137.1210& -220.2500\\ $dir=0$\\
$c$ & 0.0357& 1.2473& 0.2119&& 0.3593& -0.2755& 2.1764&& -1.2998& -3.8202& -1.2784\\
$c$ & -17.9048& -37.1111& 8.8591&& -30.7381& -9.5952& -3.0000&& -11.1631& -5.7108& -15.6728\\
$c$ & 105.5518& 232.1160& -94.7351&& 100.2497& 141.2778& -259.7326&& 52.5745& 10.1098& -140.2130\\
\bottomrule
\end{tabular}
\caption{Caption}
\end{table*}
I’m coming to the conclusion that tables, despite being made of text, should be treated as graphic elements, just like charts, figures, and photographs. Just as I would never use one of the many LaTeX drawing packages to make a scatterplot, I shouldn’t be using \begin{tabular}… \end{tabular} to make tables.
But having come to this conclusion, how do I act on it? What’s a good software tool for quickly generating good looking, well-formatted tables? As I recall, Adobe used to have an application called Tables, but I don’t how good it was. And even if it was good, it’s long since gone. Among software still available, I see three basic types:
Spreadsheets I can merge cells to get row and column spans, and there’s no trouble with multiple header lines. Cell borders of varying thickness can be added, but formatting within a cell isn’t as flexible as I’d like it to be.
Word processors Pages has inherited the table formatting features of Numbers but hasn’t added anything too them, so in-cell formatting is just as limited. MS Word has excellent in-cell formatting, but I find its user interface confusing, and I hate that I can’t see the changes I’m making as I adjust the settings in the Table Properties window. I’m sure I could learn to work around its idiosyncrasies and maybe even set up a few styles that would save me time and frustration, but I’m just not enthused with training myself to use it.
Drawing programs These, of course, can do anything. The question is whether they can be made efficient at generating tables. OmniGraffle has a way to quickly generate a rectangular table of elements which can then be edited to fit the data. Rules can be placed and adjusted with more precision than in spreadsheets or word processors, and in-cell formatting, while not quite as flexible as Word’s, has the features I need. I have a lot of experience with OmniGraffle that I can take advantage of to format a table quickly.
The biggest obstacle is getting data into an OmniGraffle table. Much of the data I put in tables comes from programs or data acquisition equipment. Either way, it’s a set of tab-separated values that I’d like to place in the table by cutting and pasting. But OmniGraffle doesn’t let you paste into a table all at once, you can only paste into one cell at a time. I’ve been trying out a script to get around this, but I’m not happy with it yet.
You may think this is a dumb idea, and I should concentrate on getting better at making LaTeX tables. You may be right. But I’ve been making LaTeX tables for 15 years, and I’m still no good at it. I think it’s time for a change. I just want to make sure it’s the right change.

