OmniGraffle and paths
June 10, 2019 at 9:20 AM by Dr. Drang
Over the years, I’ve mentioned several times that I use OmniGraffle in ways that don’t match up with its main purpose of making org charts and similar sorts of diagrams. Here’s another one.
Let’s say there’s a suspected problem with an outdoor walkway paved with bricks, and I have been asked to look into it. One of the things I need to know before getting into the meat of the investigation is how big the walkway is. This would be easy if the walkway were a regular shape, but landscape architects usually prefer more organic shapes. My solution has three steps:
- Outline the walkway in OmniGraffle. I approximate the curvy boundaries with a series of short straight lines.
- Use AppleScript to extract the coordinates of the polygon created in Step 1.
- Use Python to calculate the area from the coordinates found in Step 2.
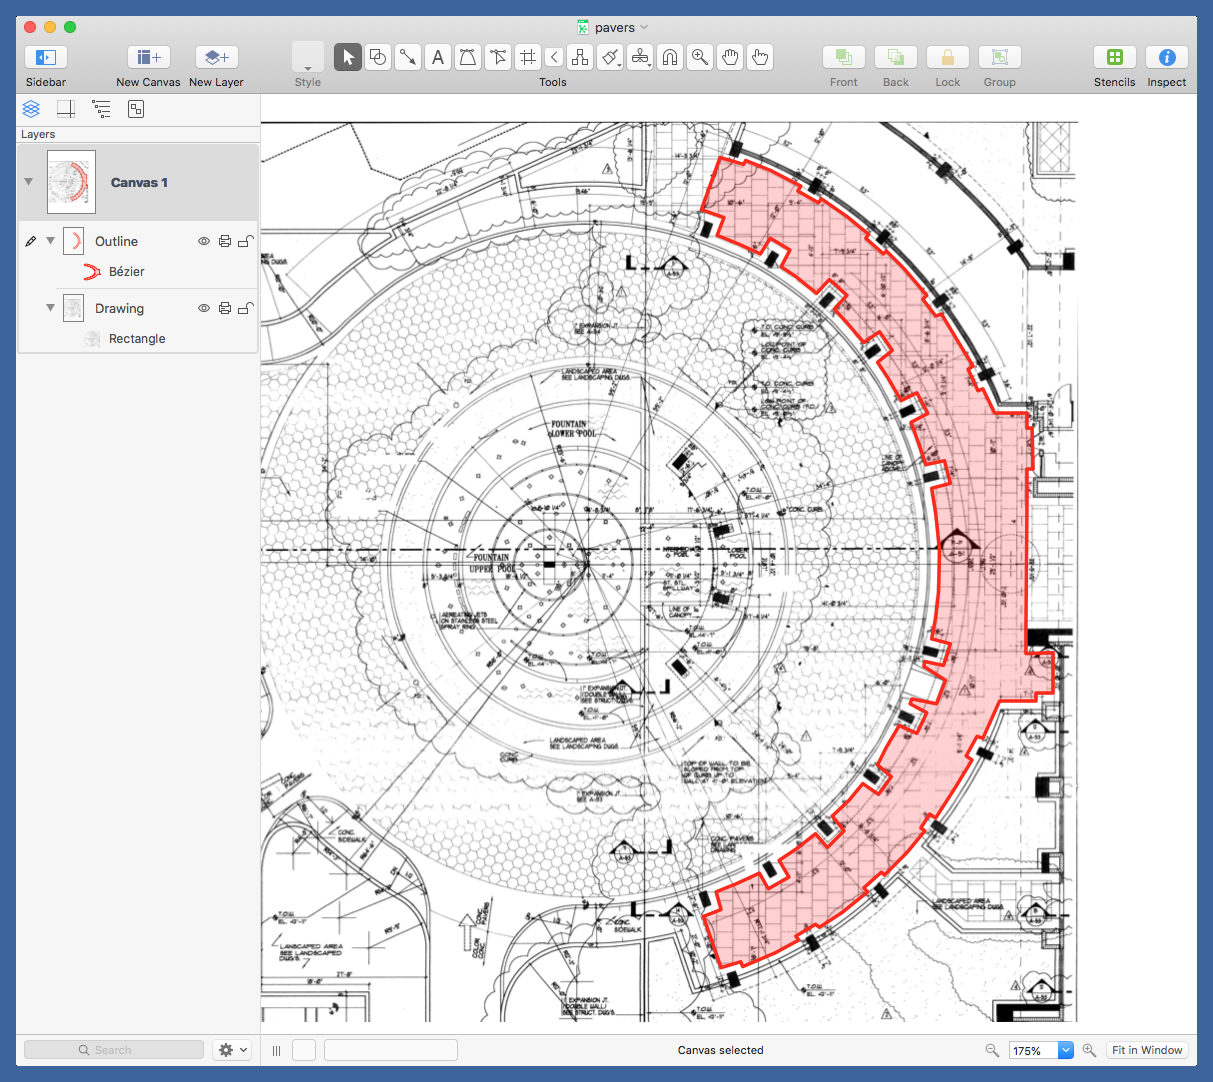
In Step 1, I import the drawing of the walkway (typically a PDF) into OmniGraffle. I put it in its own layer, and then create a layer for tracing the outline. I use the Bézier tool in this layer to click along the boundary of the drawing underneath. For accuracy in following the boundary, it helps to set the line used for the Bézier to a contrasting color with less than 100% opacity. When I’ve gone all around the boundary, I get something that looks like this:

In this drawing, to make things easier to see. I’ve made the Bézier outline thicker than I normally would, I’ve set its opacity back to 100%, and I’ve filled it with a translucent color.
Now it’s time to get the vertex coordinates of the polygon. It’s a simple AppleScript:
applescript:
1:  tell application "OmniGraffle"
2:    tell layer "Outline" of canvas 1 of document 1
3:      tell first graphic
4:        get point list
5:      end tell
6:    end tell
7:  end tell
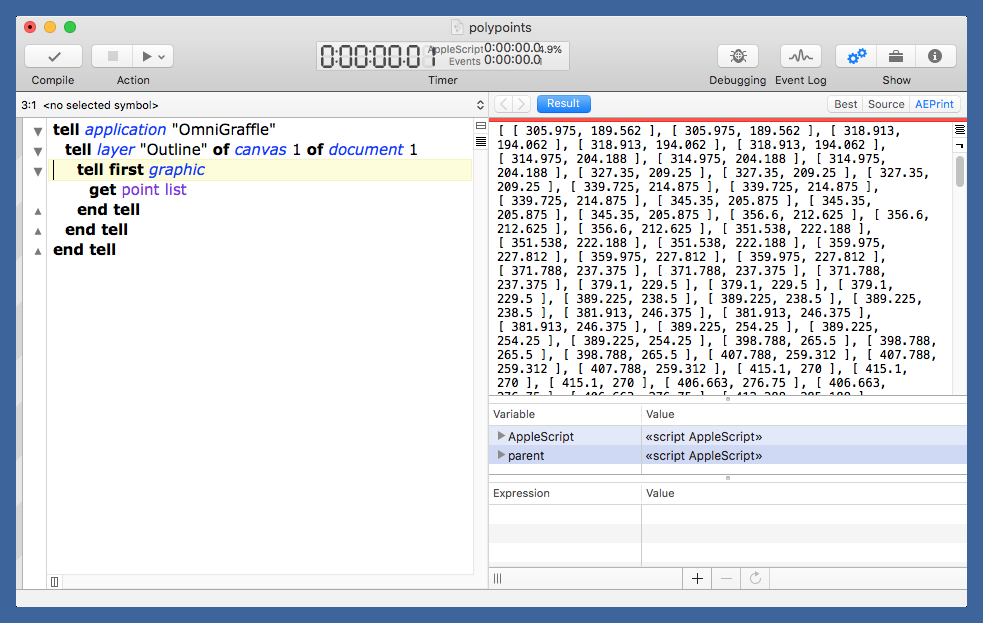
The script is called polypoints, and when I run it in Script Debugger, the results show up in one of the right-hand panes.

The output is a list of lists, which has, as luck would have it, exactly the same syntax in AppleScript as it does in Python. I can just copy it from Script Debugger and use it directly in an assignment statement in the Python script that calculates the area. Here is that script:
python:
  1:  #!/usr/bin/env python
  2:
  3:  import section
  4:  import sys
  5:
  6:  # The vertex coordinates, in points, from OmniGraffle
  7:  path = [ [305.975, 189.562], [305.975, 189.562], [318.913,
  8:    194.062], [318.913, 194.062], [318.913, 194.062], [314.975,
  9:    204.188], [314.975, 204.188], [314.975, 204.188], [327.35,
 10:    209.25], [327.35, 209.25], [327.35, 209.25], [339.725,
 11:    .
 68:    .
124:    .
125:    161.438], [331.288, 161.438], [330.163, 163.688], [330.163,
126:    163.688], [330.163, 163.688], [316.663, 159.75], [316.663,
127:    159.75], [316.663, 159.75], [305.975, 189.562] ]
128:
129:  # Flip the y-axis and scale to feet
130:  path = [ (0.2971*x, -0.2971*y) for x, y in path ]
131:
132:  # Reset origin and determine size of bounding rectangle
133:  xmin = min(p[0] for p in path)
134:  ymin = min(p[1] for p in path)
135:  path = [ (p[0] - xmin, p[1] - ymin) for p in path ]
136:  width = max(p[0] for p in path)
137:  height = max(p[1] for p in path)
138:
139:  # Areas
140:  fraction = section.area(path)/(width*height)
141:  print('{:>20s}: {:6,.0f}'.format('Paver area', section.area(path)))
142:  print('{:>20s}: {:6,.0f}'.format('Enclosing rectangle', width*height))
143:  print('{:>20s}: {:5.2%}'.format('Fraction', fraction))
For the sake of your sanity and mine, I’ve elided 115 lines of vertex data.
Regardless of document’s settings for units and scaling, the OmniGraffle AppleScript dictionary gives the coordinates of the polygon’s vertices in points. And the y coordinates measure down from the top of the document instead of up from the bottom. Neither of these conventions are useful to me, so Line 19 fixes both, flipping the y axis and converting the dimensions from points to feet.
How did I come up with the scaling factor of 0.2971? There are several dimensions given in the drawing. I took the longest one, noted its length in feet, measured it in points on the drawing, and divided to get the scaling factor.
Lines 22–26 find the smallest rectangle that encloses the polygon, resets the origin of the coordinates to the lower left corner of that rectangle, and calculates its height and width.
Line 30 uses the area function of my section properties module to report the area of the polygon. The other lines near Line 30 calculate some ancillary values that can be helpful if I need to do more than just get the area.
For instance, if I want to test some of the bricks, I can get a random sample by generating random values for x and y within the bounding rectangle and retaining only those that are inside the polygon. How do I know if a point is inside the polygon? Use the contains_point function from the matplotlib.path module.
If you’re the first one to read this far without bailing, I have a reward for you that’s sort of tangential to OmniGraffle. Brent Simmons, of NetNewsWire fame and currently of the Omni Group, sent me a promo code for OmniFocus. I’m not organized enough to use OmniFocus, but I bet some of you are and have just never given it a try. You may be especially interested now that it’s running on the web in addition to all your Apple devices.
Just be the first person to send me an email (drdrang at leancrew dot com) asking for it, and I’ll send you the code along with all the terms and conditions. The promo code expires on June 26 and works only in the US App Store. It gets you a year of OmniFocus Pro for iOS, OmniFocus Pro for Mac, and OmniFocus for the Web. You can learn about Omni’s new optional subscription service here.
Don’t expect a reply from me right away. I have a busy Monday and won’t be checking my alter-ego email address until later in the day. If you do end up winning, be sure to send thanks to Brent.
