A simple Shortcut for daily data entry
February 14, 2022 at 11:25 PM by Dr. Drang
I’ve been measuring and recording my blood pressure more or less every day since early fall. I was in the “prehypertension” range at my last checkup, and my doctor wanted me to keep track of it. I’ve been adding each day’s reading to a table in Apple Notes, which has worked out well because Notes launches quickly on my phone, and it’s easy to add a new row with each reading.
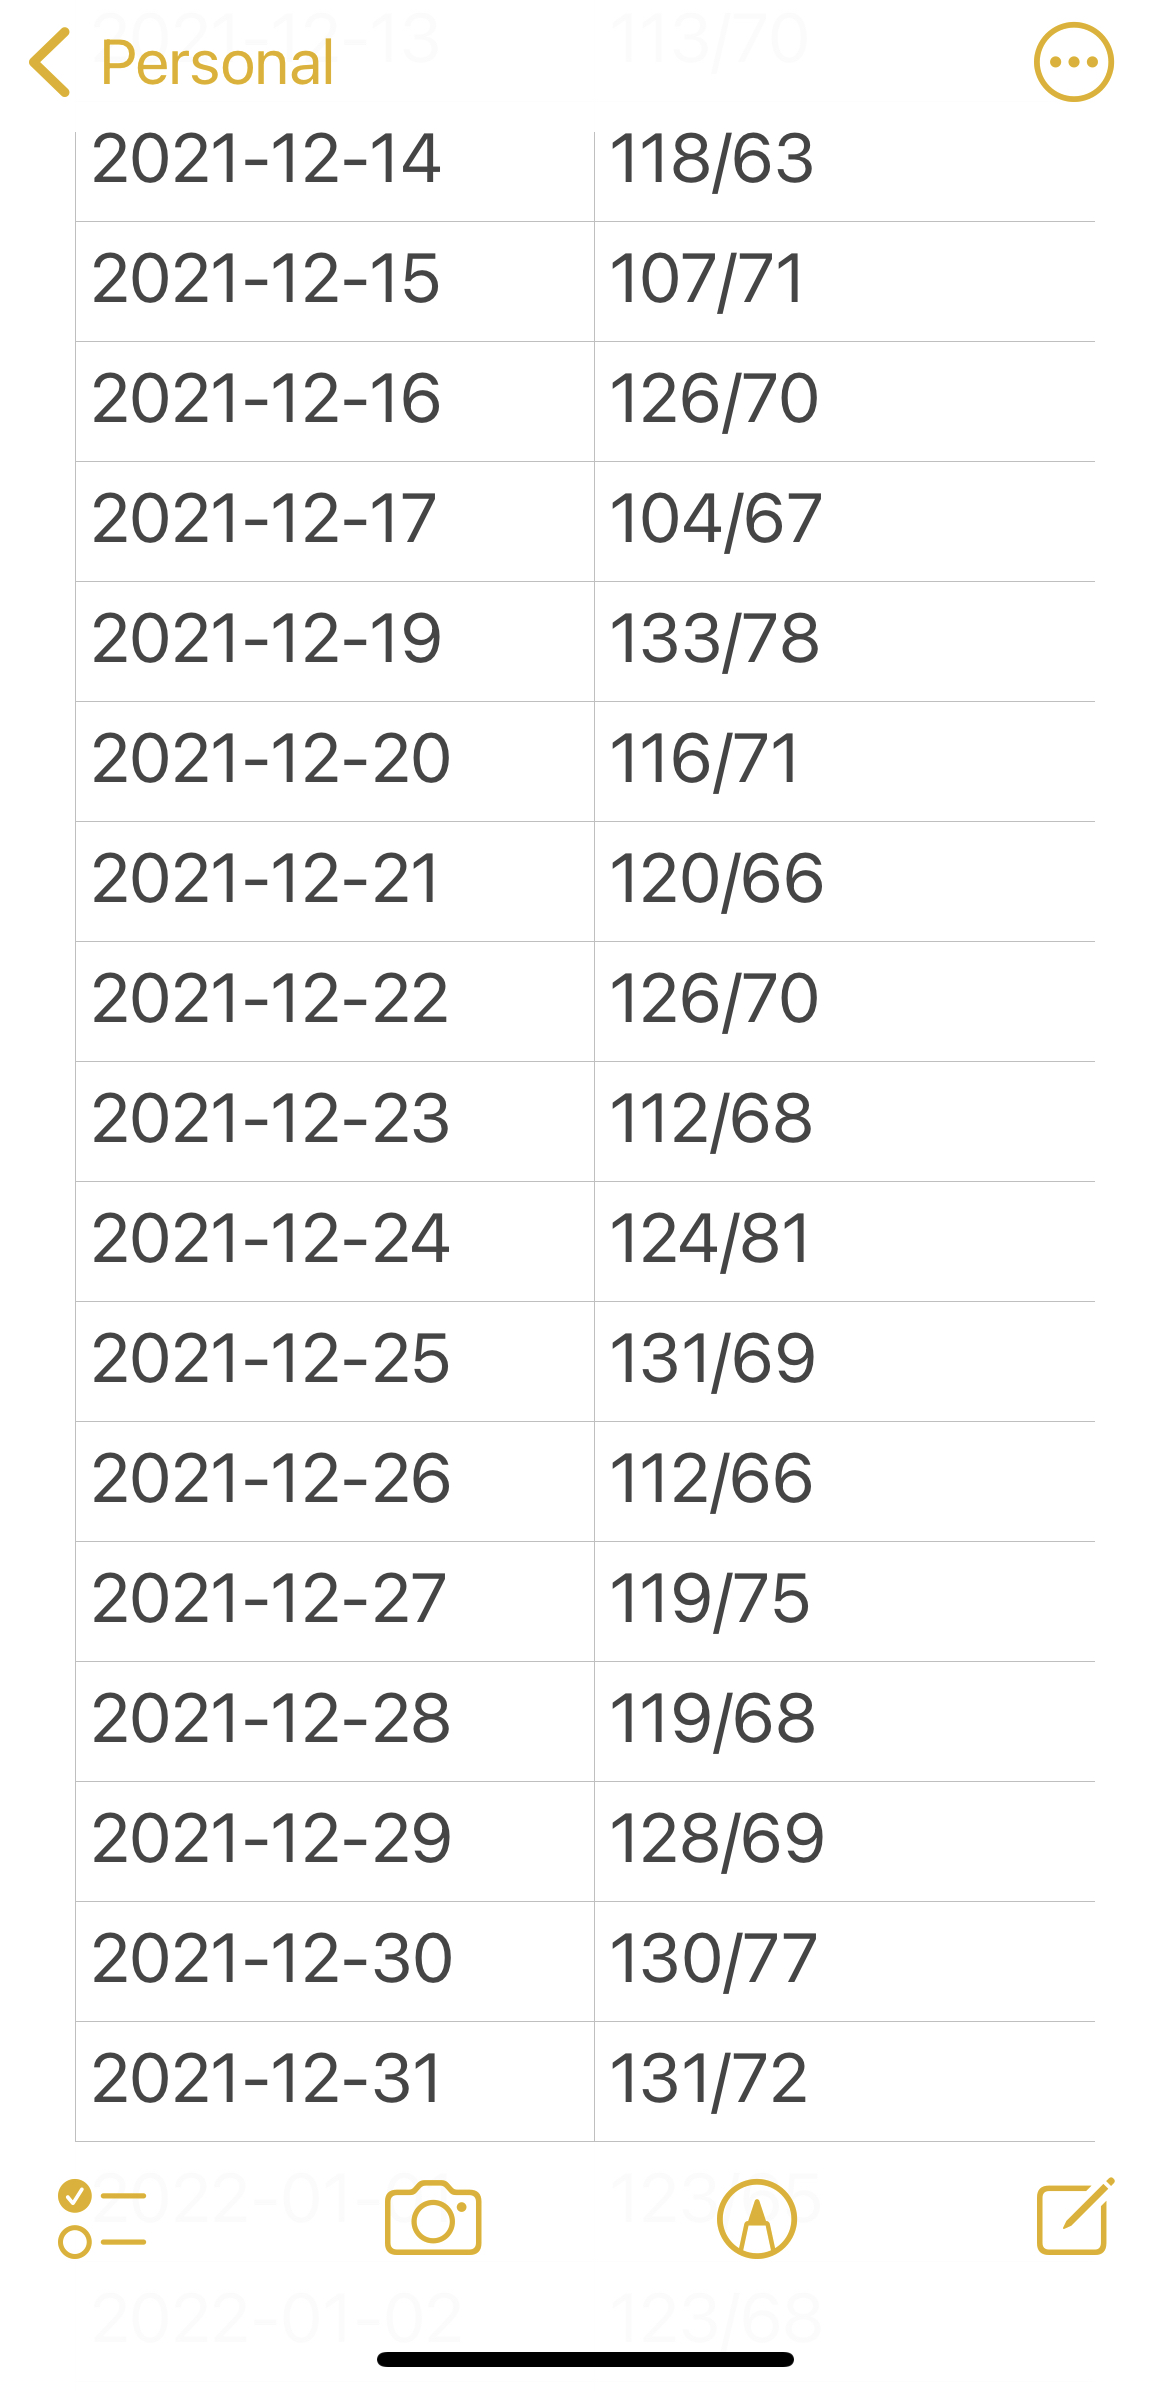
To make entering the date faster, I made a Shortcut that puts today’s date on the clipboard. That shortcut sits in a widget on my iPhone’s home screen, and I run just before opening Notes. It’s just three steps:
| Step | Action | Comment |
|---|---|---|
| 1 |  |
Get today’s date. |
| 2 | 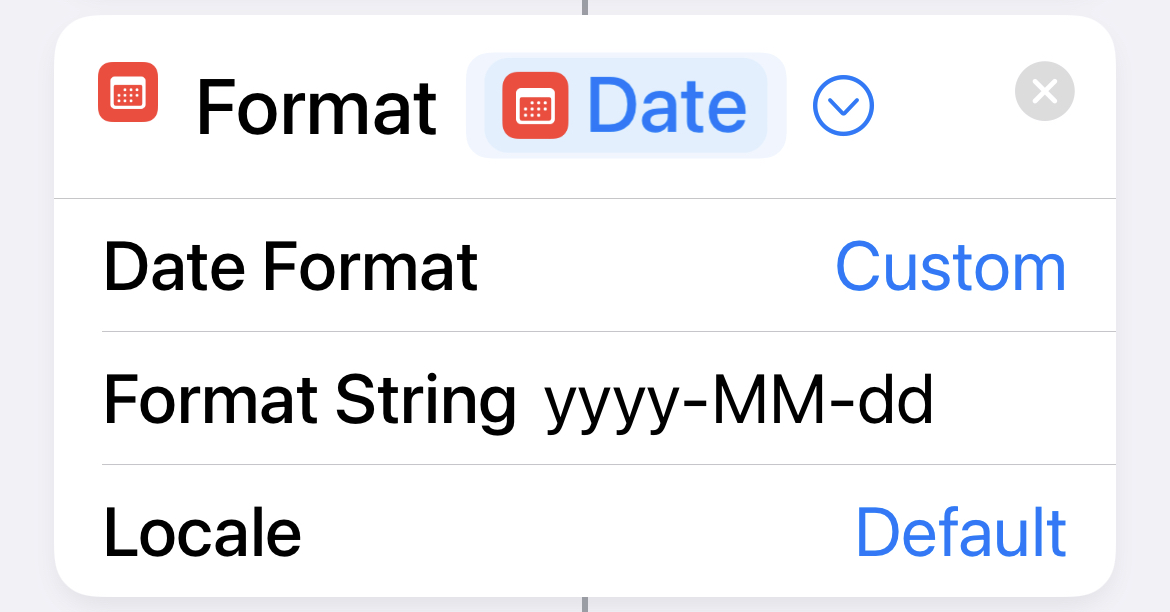 |
Format it. |
| 3 | 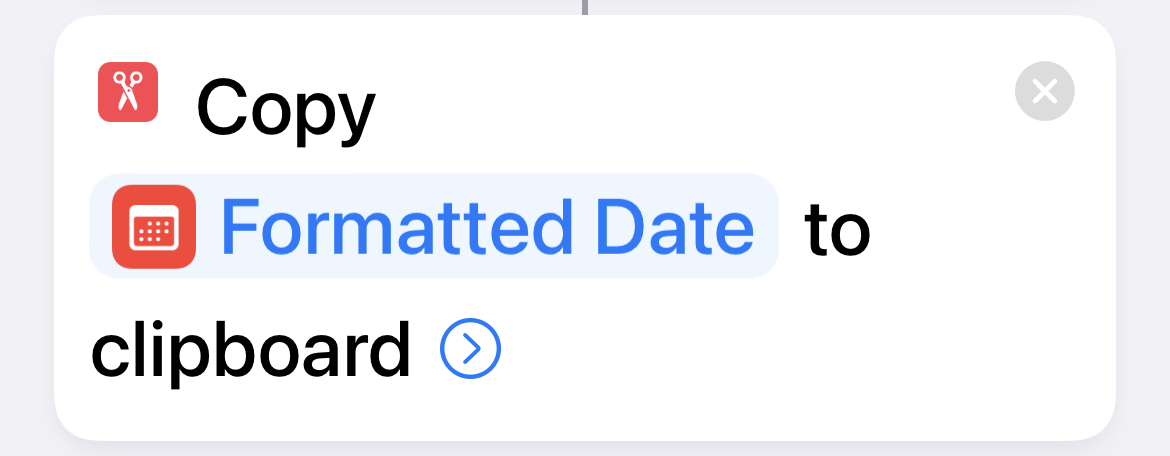 |
Put it on the clipboard. |
I used the yyyy-MM-dd format because it’s easy to parse, and I thought someday I might want to pull the data out of Notes and do something with it.
That someday came yesterday when I decided to graph the data. For me, the easiest way to do that is to start with a CSV (comma-separated values) file and use a Python script to make the graph.
To make the CSV file, I opened the note on my Mac, copied the table, pasted it into BBEdit, and did some quick editing. The resulting file, named bp.csv, looked like this:
Date,Systolic,Diastolic
2021-09-17,125,71
2021-09-18,137,72
2021-09-19,138,73
2021-09-20,124,71
etc.
From here, it was relatively simple to write a short Python script that used Pandas and Matplotlib to read in the data and plot it. I’ve written plenty about making plots in Python, so I’m not going to say any more about that—at least not in this post. I want to focus on how I streamlined my system.
The plot showed me when I had been doing well and when I had been doing poorly in controlling my blood pressure, so it seemed like a good idea to set up a system that would make a new plot every week or two. But to do so, I couldn’t rely on the manual process I had just used to take the data from Notes and turn it into a CSV file. I needed to either automate that process or create a system that would update the CSV file directly with each day’s blood pressure reading. I opted for the latter with this shortcut:
| Step | Action | Comment |
|---|---|---|
| 1 |  |
Get today’s date. |
| 2 | 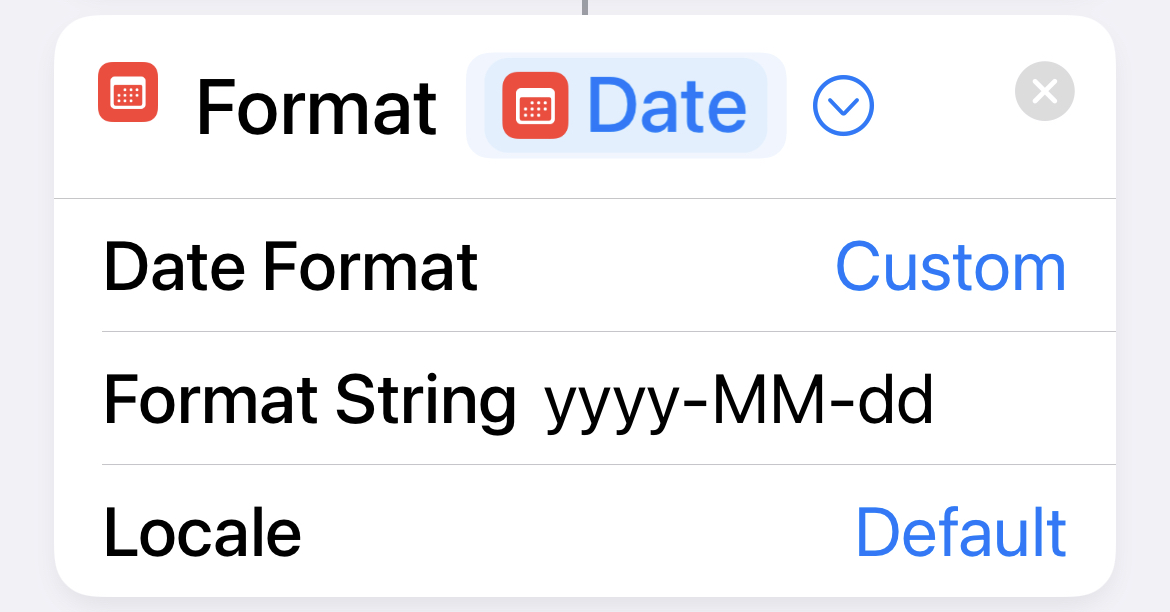 |
Format it in a form that Pandas likes. |
| 3 | 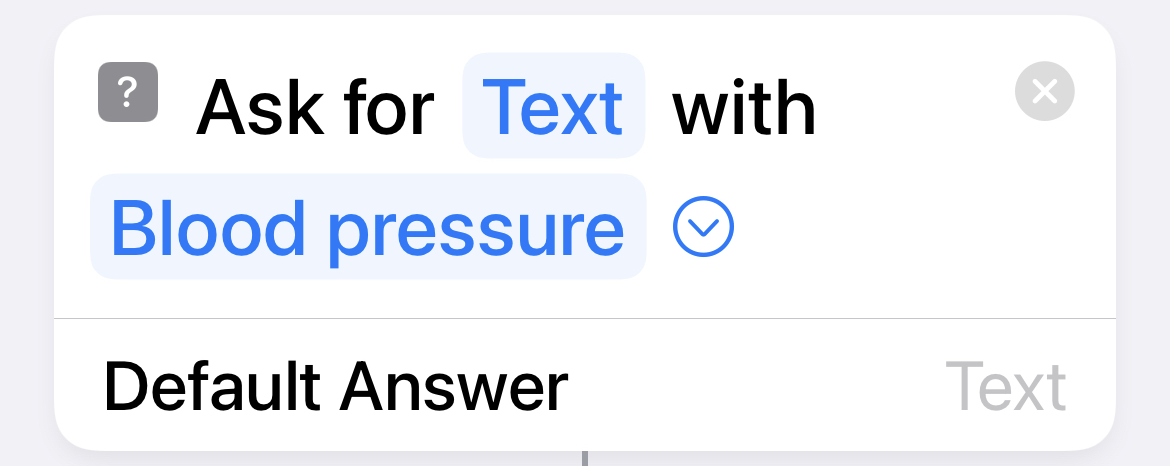 |
Prompt the user for blood pressure, which should be entered as either nnn/nn or nnn,nn. |
| 4 | 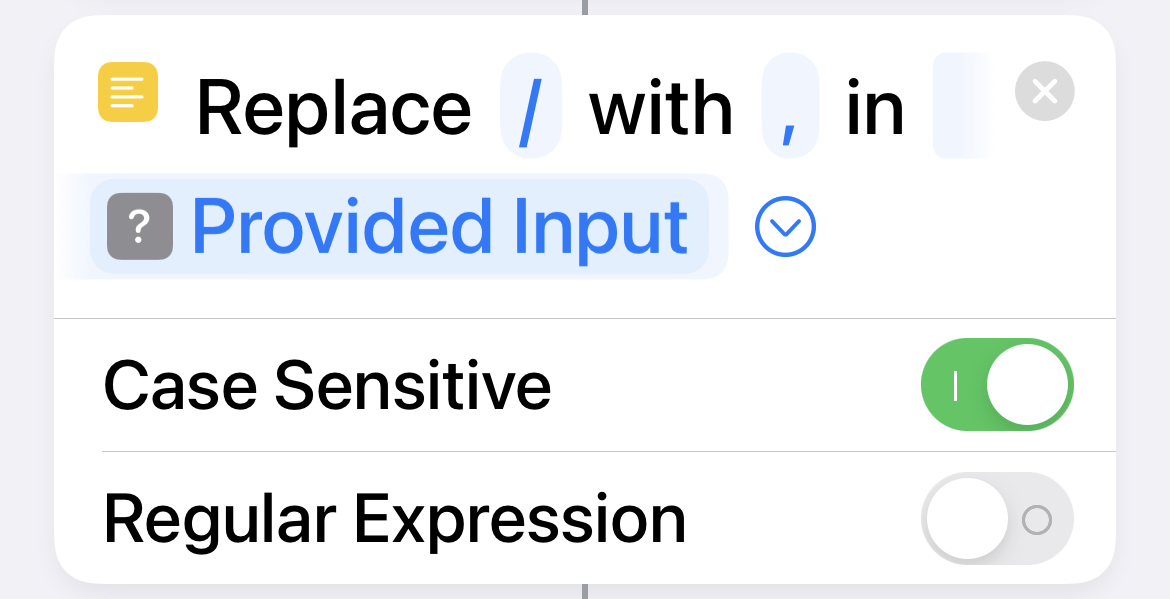 |
Separate systolic from diastolic by a comma instead of a slash. |
| 5 | 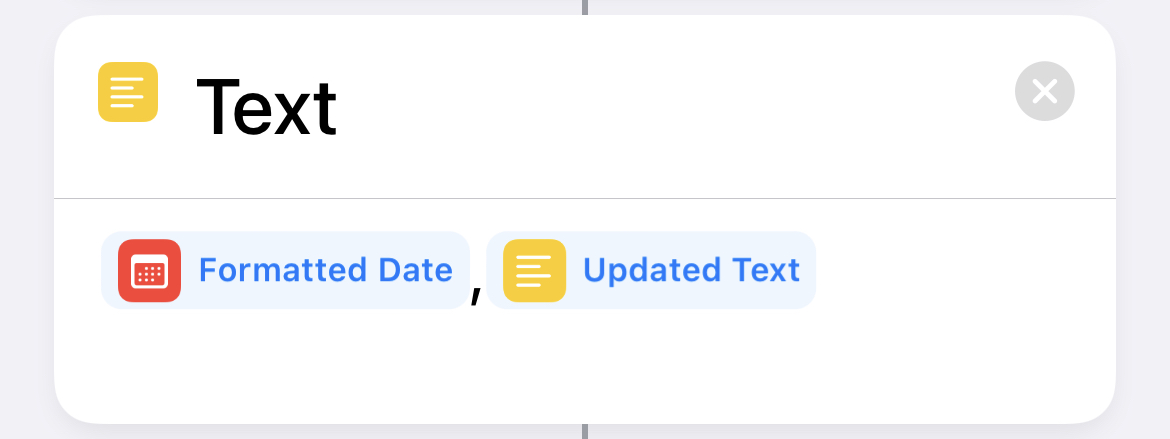 |
Assemble the CSV line for today. |
| 6 | 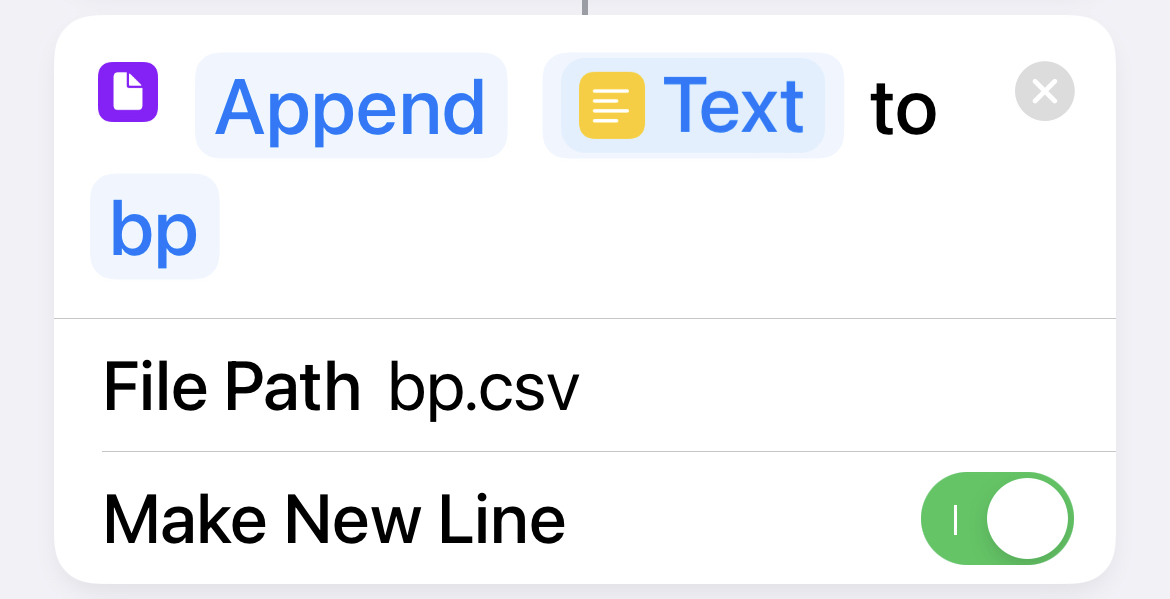 |
Append the line to the CSV file. The file is in the bp folder at the iCloud Drive root level. |
With this in a widget on my home screen, I can tap the button to launch the shortcut and enter the reading I just took. The comma-separated date, systolic, and diastolic are appended directly to the CSV file. This new system is not only better at organizing the data for plotting, it’s also faster at entering it in the first place. No need to open Notes, no need to run a shortcut to get the date, just enter the BP directly and everything is taken care of.
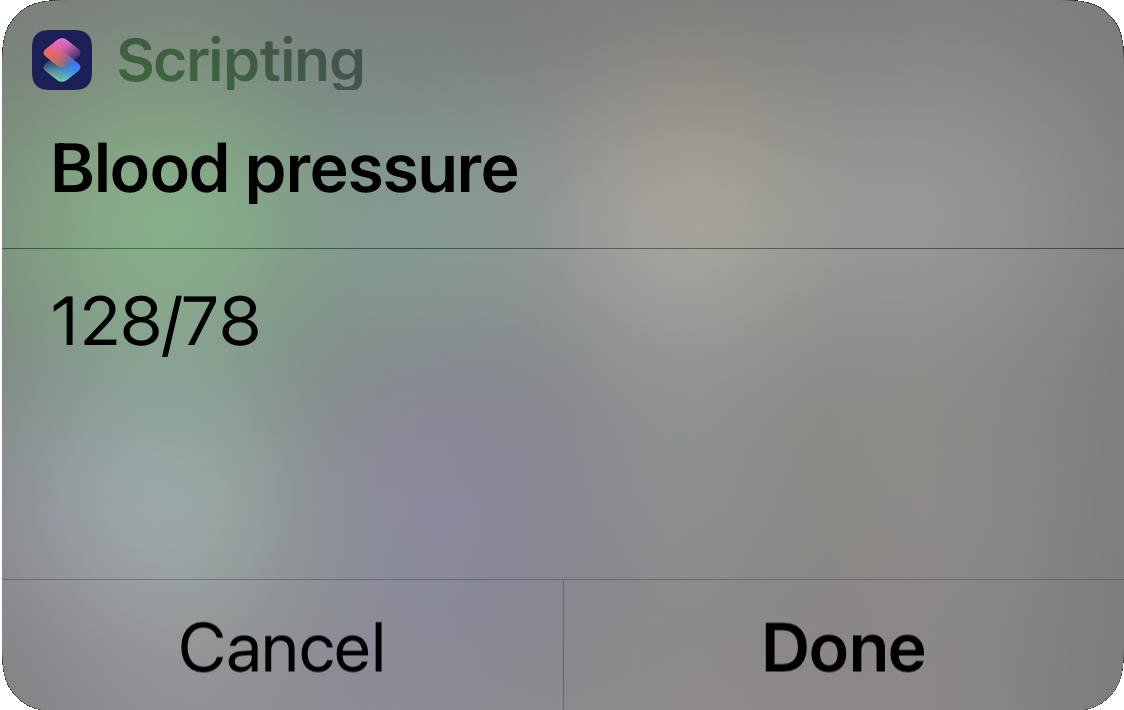
I don’t regret starting out using Notes. It was easy to set up, it synced across all my devices, and it kept the data in a format that I could export and transform. But it’s time to move on.
Update 02/15/2022 9:32 AM
A Mr. Richard Twitter of Ft. Lee, New Jersey asks1
Dear Dr. Drang,
Why don’t you put your blood pressure readings into the Health app? Couldn’t you just use the charts in Health? Or plot your blood pressure in Charty? And why don’t you buy a blood pressure cuff that will send its readings directly to Health?
Dear Mr. Twitter,
You ask a lot of questions with answers that should be obvious—even to someone from New Jersey.
The Health app is fine for tracking my walks and bike rides, but I don’t think much of it otherwise. I have basically no control over the charts it makes, and—most important—it lives exclusively on the iPhone. I want my data everywhere, and I don’t want to use workarounds to move it from one place to another. A CSV file on iCloud Drive allows me to do whatever I want.
As for Charty, it’s also more limited than I like. Plus, I use Python and Matplotlib so much, it takes almost no time for me to build a script that does just what I want.
Finally, I already had a cuff and didn’t see a need to buy a new one to get automatic connection to an app I wouldn’t use. And I’m cheap.
-
Gen Xers may think they’ve taken over the cultural nostalgia thing after the Super Bowl halftime, but Boomers will never give up. ↩

