The problem with dollars
November 1, 2025 at 9:08 AM by Dr. Drang
I stopped charting Apple’s quarterly results back in 2019 and don’t intend to return to it, but after seeing the recent posts at Six Colors and TidBITS, I thought I’d try out a new graph.
I got out of the Apple charting business shortly after Apple stopped reporting unit sales with the Q1 2019 figures.1 I care more about how many products Apple is putting into people’s hands than about how much money is passing from those hands into Apple’s pocket. I mentioned this in my penultimate quarterly charting post, and I also pointed out a problem with charting dollar sales instead of unit sales:
One unaddressed problem with [Apple’s revenue figures] is that they don’t account for inflation—something I didn’t have to worry about when I was plotting unit sales. Apple doesn’t account for inflation either, of course, but that doesn’t mean I shouldn’t. If I’m going to keep doing this, I’ll have to decide on an inflation index and a basis year.
Of course, I didn’t decide on how to handle inflation. I chickened out and stopped doing quarterly posts after just one more set of charts. And Apple is happy to ignore inflation, because doing so allows it to report most quarters as “the best ever” in one form or another.
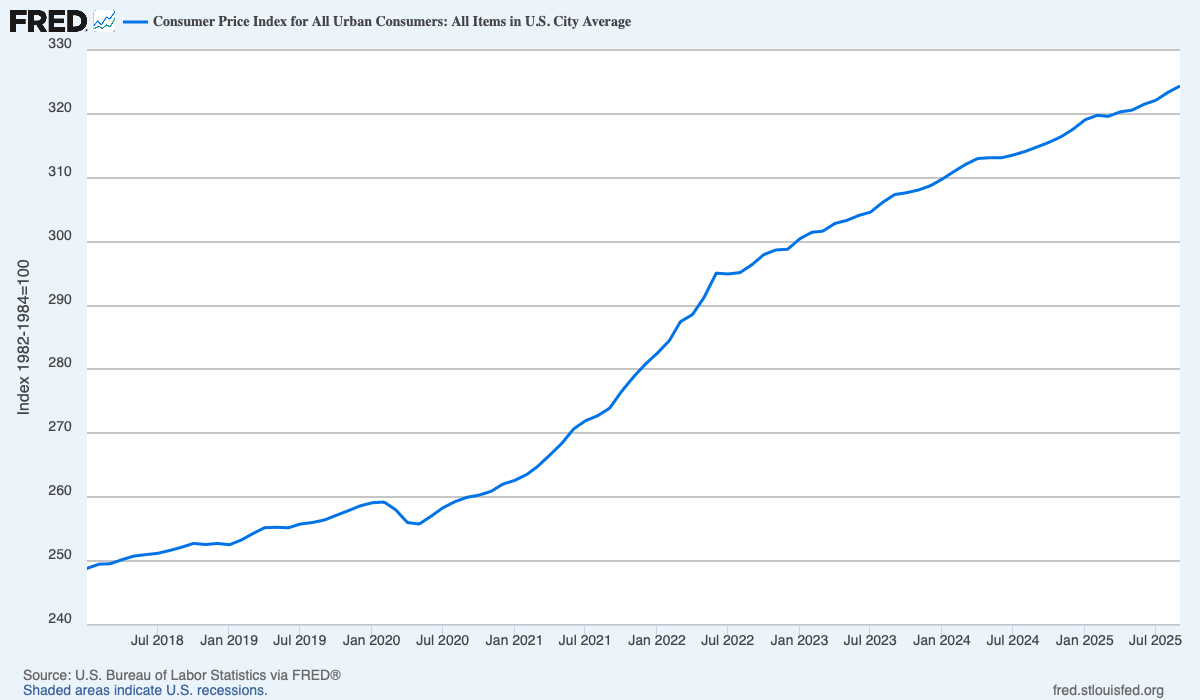
But let’s adjust Apple’s numbers for inflation and see what happens. For simplicity, I’m going to use the CPI-U Index, a common measure of inflation. It looks like this from 2018 to the present:

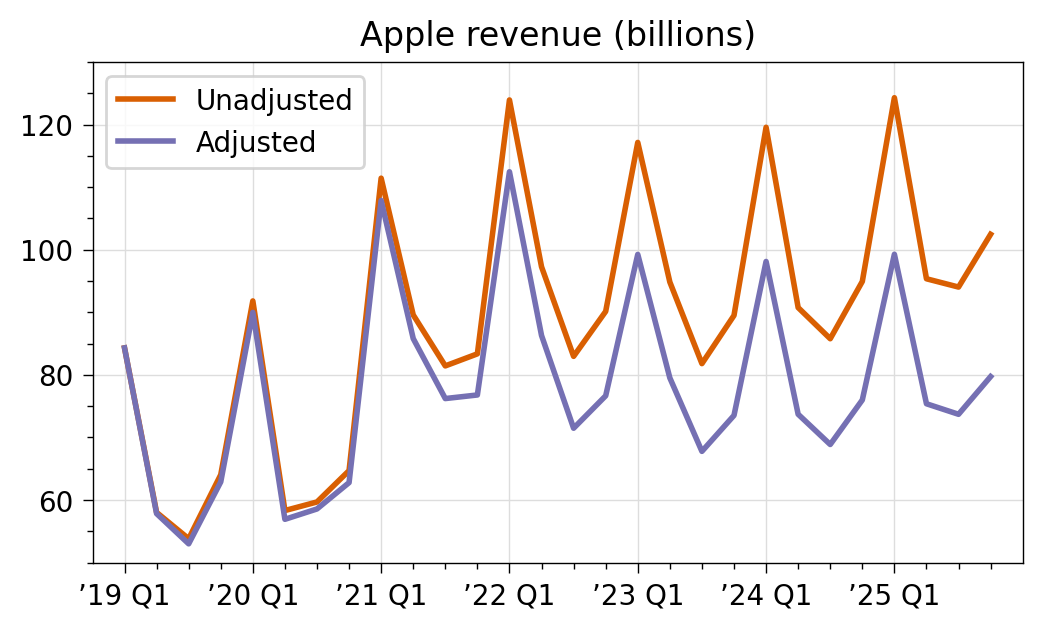
I downloaded the CPI-U monthly values from the Bureau of Labor Statistics and adjusted Apple’s revenue figures to their equivalent in Q1 2019 dollars. Here’s how that looks compared to the unadjusted revenue:

After adjustment, the climb after the big work-from-home jump isn’t as impressive, although the non-Q1 quarters of fiscal 2025 are quite good. The just-reported Q4 revenue truly is the best Q4 ever, even after adjustment.
You might say that CPI-U isn’t the right inflation measure to use. Also—as Jason Snell pointed out when I showed him this graph—Apple is a worldwide company, and there are different inflation rates in every country. But some adjustment should be made, especially if you want to graph results over several years and some of those years include the COVID inflation period. I’ve chosen the CPI-U because Apple reports its earnings in US dollars, and that’s the inflation metric most Americans are used to seeing.
This isn’t to say that it’s wrong to report the unadjusted numbers, just that accounting for inflation gives some added perspective. Does this mean I’m suggesting additional work for others that I myself don’t intend to do? Yes.
-
In case you’ve forgotten, Apple’s fiscal year ends on the last Saturday of September, so Q1 2019 covers roughly October through December of 2018. ↩
