Energy dissipation in damped vibrations
August 27, 2014 at 6:21 PM by Dr. Drang
In the previous post in this series (which was four months ago—time flies), we looked at the free vibrations of damped single-degree-of-freedom (SDOF) systems, systems that can be modeled as a spring-mass-dashpot like this:
The position of the mass, , can be expressed as a function of time, , through the formula
where is the natural frequency of the undamped system, is the frequency of the damped system, and is the damping ratio. They’re related to the physical properties of the system through these equations:
The other two variables, and , are determined through the initial position and velocity of the mass. As discussed before, we can start our clock at any time we like; we can, without any loss of generality, set at a point that will lead to . This simplifies the solution to
Taking the derivative of gives us the velocity:
where we’re using Newton’s dot notation for derivatives with respect to time.
In an earlier post, we calculated the total mechanical energy of an undamped system and showed how it remains constant over time. Let’s look at the mechanical energy of our damped system. The potential energy is
and the kinetic energy is
Because , the kinetic energy can also be written as
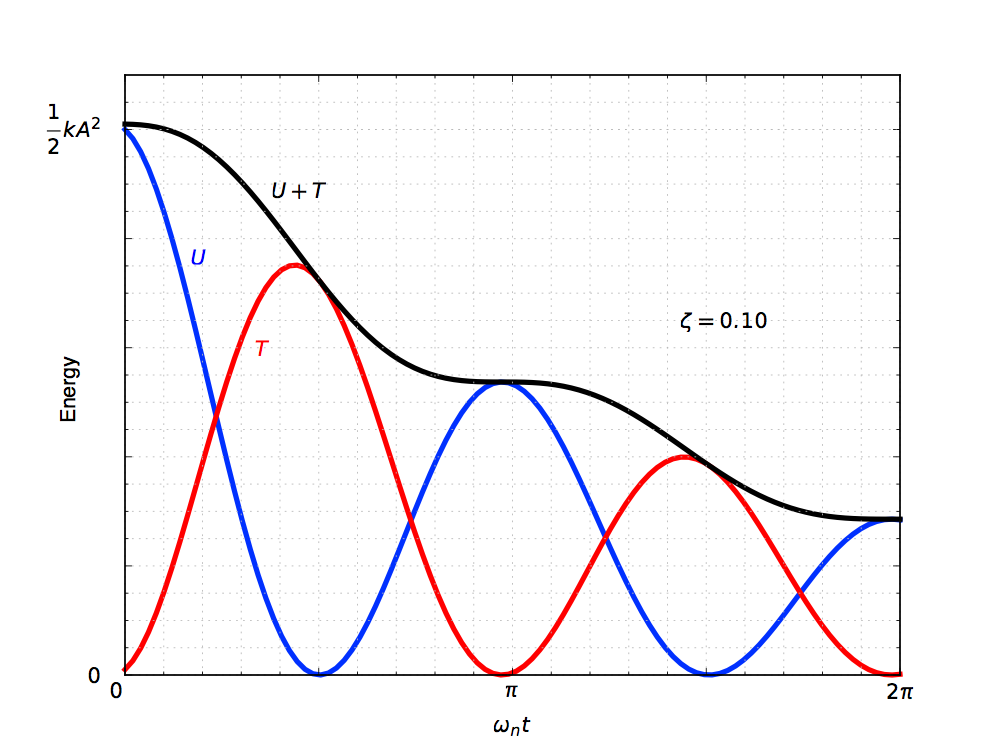
The total mechanical energy is the sum of these two, . Instead of giving it as a long formula, let’s plot it. We’ll have to choose a particular damping ratio, so let’s go with .
Note how the total mechanical energy decreases with time. Where is it going? It’s being dissipated as heat as the fluid in the dashpot gets pushed back and forth by the piston. The total energy curve is wavy because the activity of the dashpot changes with time. When the mass is near the extreme left and right ends of its travel (when ), its velocity is nearly zero and the dashpot isn’t doing much. The total energy is nearly constant during these times. On the other hand, when the mass is moving quickly (when ), the dashpot is at its peak of activity and the total energy drops rapidly.
At the end of the previous post, I questioned the usefulness of analyzing a spring-mass-dashpot system:
Mechanical systems have springy parts and they have mass, but very few have actual dashpots. What good is all this math if it doesn’t represent actual equipment? We’ll talk about the kinds of real-world things we model as dashpots next time.
We model systems using dashpots because that leads to differential equations that we can solve. What we model as dashpots are things that dissipate mechanical energy from the system. For example:
- Sliding friction
- Material damage and flow
- Hysteresis
Sliding friction is very common—almost unavoidable. It occurs at joints where parts are supposed to move relative to one another, like hinged joints; but it also occurs at joints where the part aren’t supposed to move relative to one another, like bolted joints. Surfaces held together by bolts are supposed to remain fixed, but they slide anyway—a little bit, back and forth—as the machine or structure vibrates. This slippage causes the parts to heat up, and it’s that transformation of mechanical energy into heat that causes the total mechanical energy of the system to decrease
Materials deformed beyond their elastic limit cannot spring back to their original state, leading to a loss of mechanical energy. Energy is also consumed when cracks form in a material because it takes energy to create the new surfaces on either side of a crack. This is a very common mechanism for energy dissipation in concrete structures.
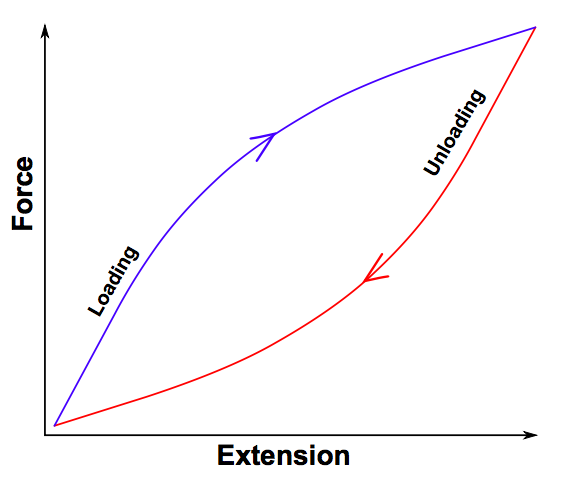
Both plastic deformation and cracking are forms of hysteresis, but hysteresis also occurs anytime the loading and unloading curves of a material don’t match up.
Image from Wikipedia.
The energy lost during a cycle of loading and unloading is represented by the area between the two curves. Hysteresis can occur in metals even when they’re loaded below the elastic limit, especially when the loading is rapid.
None of these dissipation mechanisms match the dashpot mathematically—that is, the energy loss wouldn’t follow perfectly the wavy curve shown in the energy plot. But we can choose a value of that makes the total energy loss the same, and that’s often good enough. Engineering is not science. The goal of engineering is not to understand our systems perfectly (which we could never achieve); the goal is to understand them well enough to build devices that work.


