A Typinator snippet for plotting
January 14, 2024 at 12:02 PM by Dr. Drang
My last post ended with this graph:
It was made, as most of my graphs are, using Python and Matplotlib. Here’s the code that did it:
python:
 1:  #!/usr/bin/env python
 2:
 3:  import matplotlib.pyplot as plt
 4:  from matplotlib.ticker import MultipleLocator, AutoMinorLocator
 5:  import numpy as np
 6:  import sys
 7:
 8:  # Array of angles in degrees
 9:  theta = np.arange(0.5, 90.0, 0.5)
10:
11:  # Arrays of friction coefficients
12:  muFloor = 1/(2*np.tan(theta*np.pi/180))
13:  muBoth = np.sqrt(1 + np.tan(theta*np.pi/180)**2) - np.tan(theta*np.pi/180)
14:
15:  # Create the plot with a given size in inches
16:  fig, ax = plt.subplots(figsize=(6, 4))
17:
18:  # Add the lines
19:  ax.plot(theta, muFloor, '-', color='#1b9e77', lw=2, label="Floor only")
20:  ax.plot(theta, muBoth, '-', color='#d95f02', lw=2, label="Wall and floor")
21:
22:  # Set the limits
23:  plt.xlim(xmin=0, xmax=90)
24:  plt.ylim(ymin=0, ymax=2)
25:
26:  # Set the major and minor ticks and add a grid
27:  ax.xaxis.set_major_locator(MultipleLocator(15))
28:  ax.xaxis.set_minor_locator(AutoMinorLocator(3))
29:  ax.yaxis.set_major_locator(MultipleLocator(.5))
30:  ax.yaxis.set_minor_locator(AutoMinorLocator(2))
31:  # ax.grid(linewidth=.5, axis='x', which='major', color='#dddddd', linestyle='-')
32:  # ax.grid(linewidth=.5, axis='y', which='major', color='#dddddd', linestyle='-')
33:
34:  # Title and axis labels
35:  plt.title('Leaning ladder problem')
36:  plt.xlabel('Ladder angle (degrees)')
37:  plt.ylabel('Friction coefficient')
38:
39:  # Make the border and tick marks 0.5 points wide
40:  [ i.set_linewidth(0.5) for i in ax.spines.values() ]
41:  ax.tick_params(which='both', width=.5)
42:
43:  # Add the legend
44:  ax.legend(loc=(.58, .62), frameon=False)
45:
46:  # Save as SVG
47:  plt.savefig('20240110-Friction comparison graph.svg', format='svg')
In broad outline, this is how nearly all of my Matplotlib graphs are made, because I have a Typinator snippet that inserts generic plot-making code that I modify to set the limits, tick marks, legend, etc. that are appropriate for the graph.
By the way, I don’t think I’ve mentioned here that I’ve switched to Typinator. Ergonis was having a sale at the tail end of 2022, and I decided to give it a go. I had been using Keyboard Maestro for my snippets for several years, but KM isn’t truly meant for text expansion, and I wanted to move to something more built-for-purpose. TextExpander would, I suppose, be the obvious choice, but I didn’t want another subscription. Typinator looked to have all the features I needed, and I haven’t regretted the choice in the year I’ve been using it.
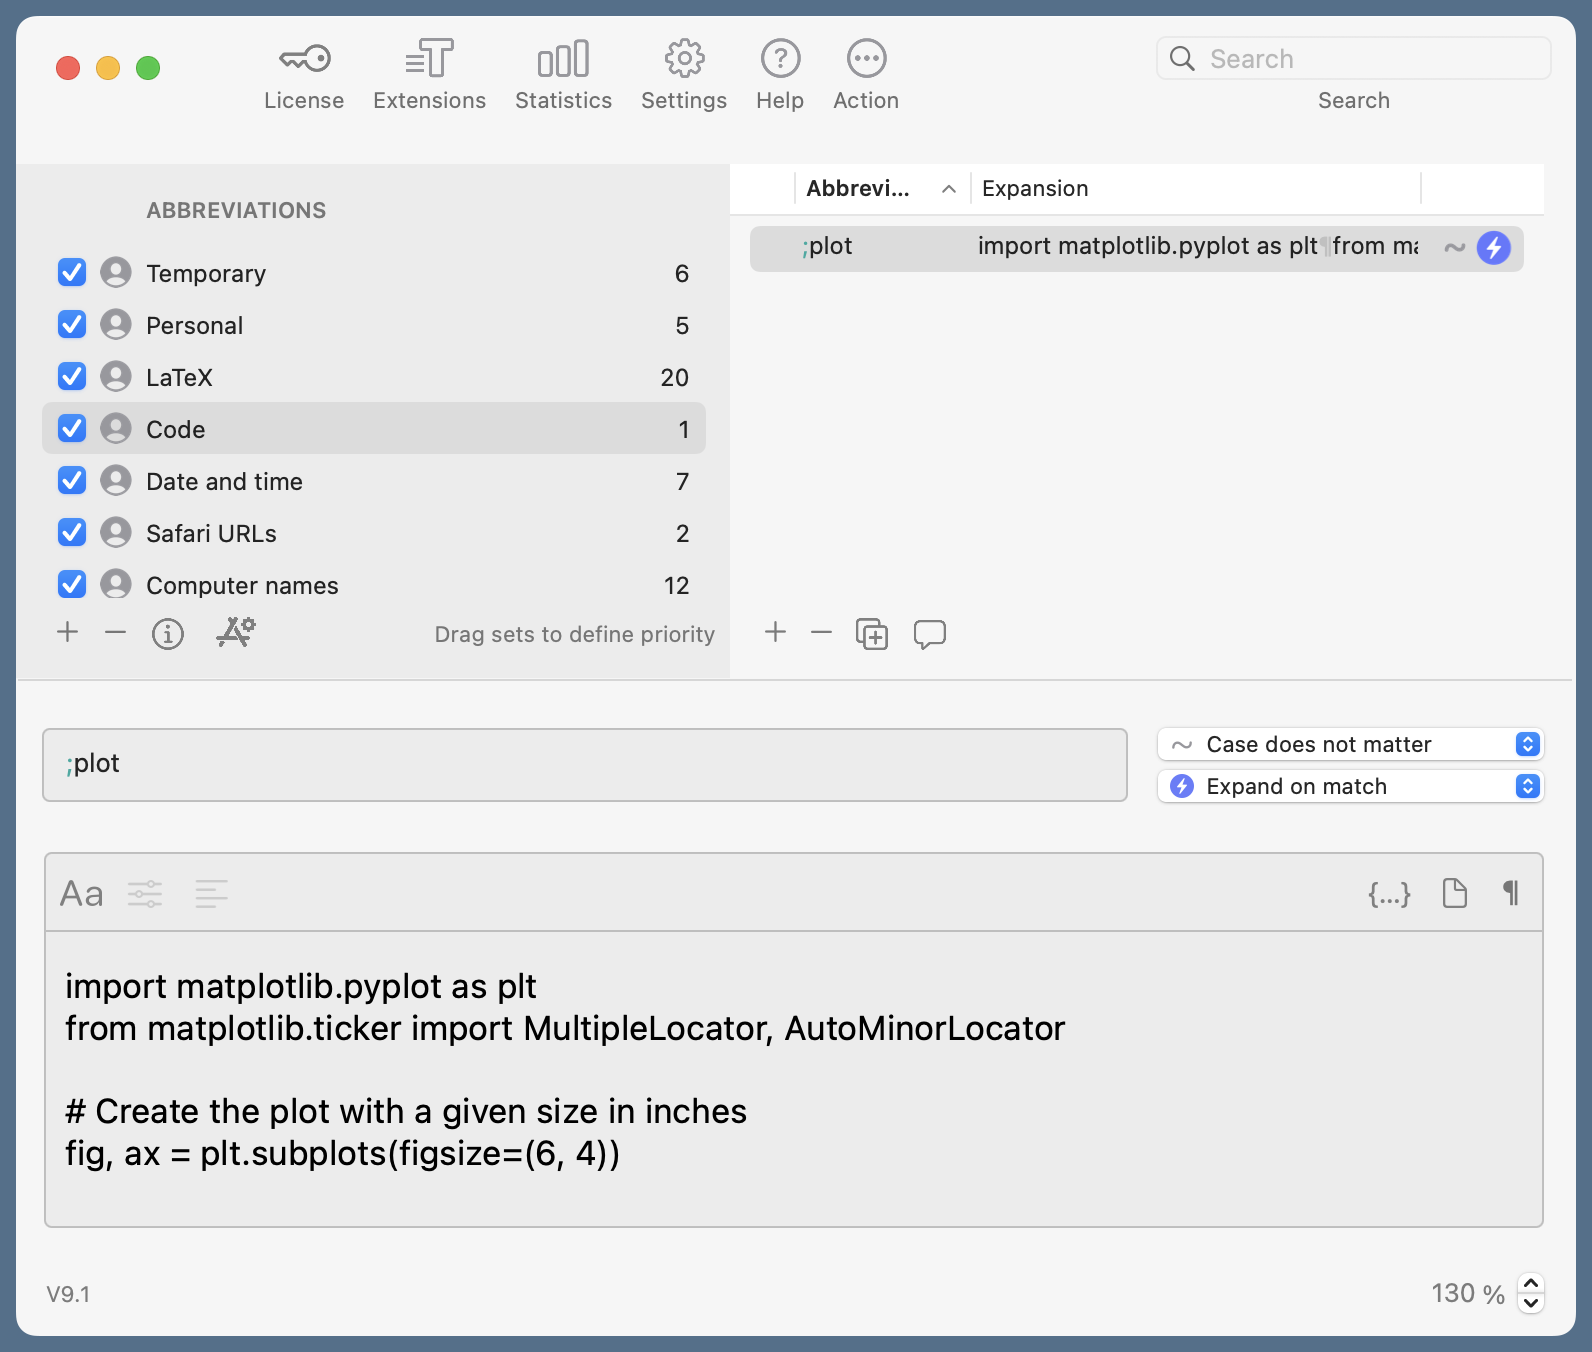
Anyway, here’s the Typinator definition of my plotting snippet:

As you can see, the abbreviation is ;plot. As you can’t see, at least not fully, the expansion is this:
import matplotlib.pyplot as plt
from matplotlib.ticker import MultipleLocator, AutoMinorLocator

# Create the plot with a given size in inches
fig, ax = plt.subplots(figsize=(6, 4))

# Add a line
ax.plot(x, y, '-', color='blue', lw=2, label='Item one')

# Set the limits
# plt.xlim(xmin=0, xmax=100)
# plt.ylim(ymin=0, ymax=50)

# Set the major and minor ticks and add a grid
# ax.xaxis.set_major_locator(MultipleLocator(20))
# ax.xaxis.set_minor_locator(AutoMinorLocator(2))
# ax.yaxis.set_major_locator(MultipleLocator(10))
# ax.yaxis.set_minor_locator(AutoMinorLocator(5))
# ax.grid(linewidth=.5, axis='x', which='both', color='#dddddd', linestyle='-')
# ax.grid(linewidth=.5, axis='y', which='major', color='#dddddd', linestyle='-')

# Title and axis labels
plt.title('{{?Plot title}}')
plt.xlabel('{{?X label}}')
plt.ylabel('{{?Y label}}')

# Make the border and tick marks 0.5 points wide
[ i.set_linewidth(0.5) for i in ax.spines.values() ]
ax.tick_params(which='both', width=.5)

# Add the legend
# ax.legend()

# Save as PDF
plt.savefig('{{?File name}}.pdf', format='pdf')
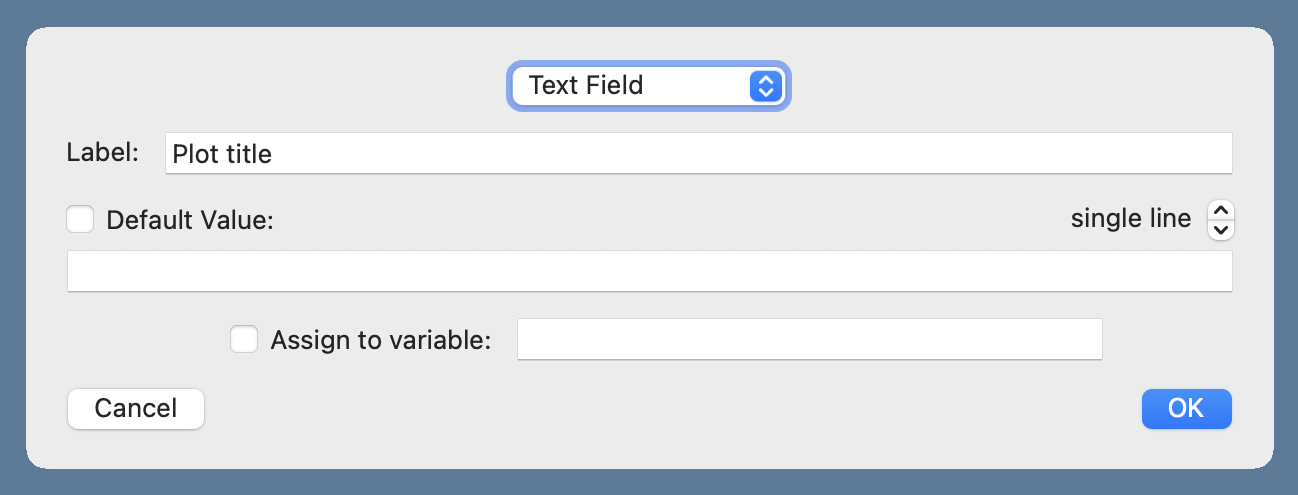
Typinator uses special syntax for placeholder text. In this case, the placeholders are
- The plot’s title:
{{?Plot title}} - The x-axis label:
{{?X label}} - The y-axis label:
{{?Y label}} - The file name:
{{?File name}}
I don’t have to remember this syntax. The {…} popup menu has a bunch of placeholder options and will insert the correct code when you define the placeholder.

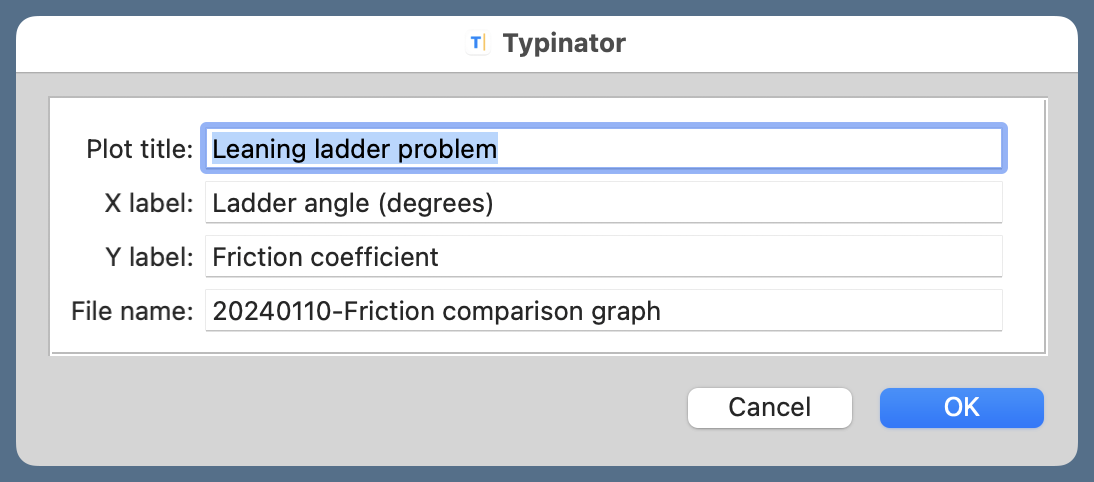
When I type ;plot, this dialog box appears to enter the text for each placeholder:

Typinator remembers the last text I entered for each placeholder, which makes things go faster if I’m doing a series of similar graphs.
If you go through the snippet, you’ll see that many of the lines of Matplotlib code are commented out, in particular those that set the formatting of the graph. That’s because I usually like to see what Matplotlib comes up with by default. If I don’t like the defaults, I uncomment the appropriate lines and start tinkering. You’ll also notice that this produces PDFs by default; that’s because the plots I make for work have always been PDFs. As I expect to be writing very few work reports from now on, I’ll probably change the file format in the last line from PDF to SVG or PNG.

