
My rules for using spreadsheets
August 1, 2026 at 10:29 AM by Dr. Drang
My fundamental rule is Don’t, but a single word wouldn’t make for much of a blog post.
In what follows, I hope to explain how I’ve come to that rule and the exceptions I make to it. I’ve been thinking about how I use and don’t use spreadsheets quite a bit lately. This introspection was inspired in part by Allison Sheridan’s presentation at Macstock (which you can see on her site along with a couple of other recent spreadsheet posts) and in part by my recent use of Numbers to make difference tables and clean up a table of data.
Let’s start by considering what makes spreadsheets so attractive. Right off the bat, you’re presented with a grid of cells that act as data containers. You don’t have to define these containers, you don’t have to name them, you don’t have to initialize them—they’re just there, waiting for you to fill them as you see fit.
When it comes time to start operating on this data, you still don’t have to name the cells. You just click (or click and drag) to fill in the function arguments. The spreadsheet app fills in the appropriate row/column reference. If you want a reminder of what a cell is for, you can type a name or description in an adjacent cell. Similarly, you don’t have to figure out the appropriate order of the operations. The app works out the cell dependency chain and recalculates everything, everywhere, all at once.
And because you can set the size, color, border, and font styling of every cell, your spreadsheet can generate nice-looking tables for inserting into your reports, memos, and slideshows.
So a spreadsheet is a data store, a logic machine, and a presentation tool. Are you getting it?
But if spreadsheets are all that, where does my Don’t rule come from? There are many sources, but I’d have to say I’ve been strongly influenced by the last 10–15 years of my working life, during which time I had to analyze dozens and dozens of data sets, all of which were sent to me as Excel spreadsheets. The engineering firms that sent me the spreadsheets had created them not simply as data stores. They included some of their own analysis (which typically overlapped slightly with mine), and they formatted the spreadsheets as tables to put into their own reports. This made my work harder for a few reasons:
Because I had to make sure I understood and agreed with their analysis, I had to review all their formulas. Some of these formulas were complex—nested
IFstatements are easy to follow in a traditional programming language, but they’re a mess in a spreadsheet. Some were inconsistent—different rows in the same table would have different formulas, as if they were written by different people at different times or adapted from a spreadsheet on a previous project. Some of them referred to cells that were far away and required a lot of scrolling to track down. None of them—not a single one in over a decade—used cell names to help make the formulas easier to understand.The complicated formulas mentioned above sometimes—not often, but sometimes—contained mistakes. And sometimes the formulas were correct, but the descriptions in the header cells were wrong. This meant phone calls were needed to resolve the discrepancies, further slowing the analysis.
- It was common for the data to be split over two or more sheets. I think this was done mainly to make the tables fit better into the other engineers’ reports, which was fine for their purposes but not for mine. I had to recombine the data for my analyses. Also, the sheets often had complicated, multiline headers, which meant I couldn’t just export them as CSV files.
- Every engineer I worked with built their spreadsheets in a different way. Those who worked for the same firm didn’t adhere to an “ABC Engineering” house style. Even individual engineers would change their spreadsheet styling from one project to the next. Basically, every spreadsheet that came in the door was sui generis, and I had to do all the data cleaning by hand. This slowed me down, not only because I couldn’t rely on automation for this step, but also because I had to double- and triple-check my work to avoid copy/paste mistakes.
Fundamentally, this experience—especially Item 1—soured me on the use of spreadsheets for anything large or complex. The engineers I was working with were smart, but their spreadsheets weren’t. My conclusion was that the simplicity of the typical click-and-drag method of assembling a spreadsheet encouraged poor organization and errors as the spreadsheets grew or were adapted to new data. It’s easy to say “Oh, I would never do that,” but I’m old enough to know that I would do that. I see the ease with which I can build spreadsheets with today’s apps as a Siren song that will lead me onto the rocks.
(If you’re getting ready to write to me about the Reinhart/Rogoff paper, you can relax. It is the prime example of elementary spreadsheet errors—errors that two Harvard professors would surely never make—and it led to a lot of suffering through unnecessary government austerity policies. And if you’re now getting ready to write to me about how Reinhart and Rogoff’s errors don’t negate the essential truth of their conclusions, you can just fuck off.)
The convenience of having the data and the analysis logic in the same document becomes a problem when you have to apply that logic to several datasets, especially when they differ in size. Spreadsheet templates are great when the data allow you make several spreadsheets with the exact same layout, but the data I tend to deal with don’t fit that rigid pattern. If I’m doing, for example, analyses and plots of several time series, those series seldom extend over the same length of time and the same number of data points. It’s far easier to deal with these size differences when the logic is in a program, separated from the data.
Another problem with spreadsheets is that the amount of data they can contain is more limited than when you use other data analysis workflows. The size limits on spreadsheets are, admittedly, quite large, but in an era of Big Data “quite large” may not be big enough. In her Macstock talk, Allison shows how she ran into that problem with the data set of US baby names. Let’s take a detour to talk about handling that data.
One of the ways you can download the baby name dataset is as a zipped collection of CSV files. Each file in the collection is associated with one year and has a name like yob1960.txt. The contents look like this:
Mary,F,51472
Susan,F,39208
Linda,F,37316
Karen,F,36378
Donna,F,34138
[etc]
where the first item is the name, the second is the sex at birth, and the third is the number of babies given that name in that year. The lines are ordered first by sex and then by number. If you concatenate all the files, you’ll find there are 2,181,032 entries. As Allison found out, this won’t fit into an Excel spreadsheet, as Excel is limited to 1,048,576 rows. That’s the very computery number or . The limit in Numbers is the less computery but more human 1,000,000 rows.
Allison got around the size problem by… er… cheating. She eliminated the less popular names to get the list to fit into Excel, and then demonstrated some pivot table stuff. You can see it starting at 1:13:50 in the video.
I decided to do something similar to her work but without the cheating. First, I concatenated all the individual files into one big CSV file that also included a field for the year. That was done through these shell commands:
echo 'Year,Name,Sex,Count' > all-years.csv
for f in yob*.txt; do
  y=${f:3:4}
  sed -e "s/\r$//;s/^/$y,/" $f >> all-years.csv
done
The year is extracted from the file name through substring expansion and then added to the beginning of each line via sed. The original files are in Windows format with CRLF line endings, so the sed command also deletes the CR characters. The upshot of all this is a file (with Unix line endings) named all-years.csv that looks like this:
Year,Name,Sex,Count
1880,Mary,F,7065
1880,Anna,F,2604
1880,Emma,F,2003
1880,Elizabeth,F,1939
1880,Minnie,F,1746
[etc]
(Yes, even though the data set is said to have come from Social Security registrations, it starts in 1880, decades before the Social Security Act. I can’t explain that. Nor can I explain how Minnie was once the fifth most popular girls’ name.)
I’m going to use Python and Pandas to extract the five most popular girls’ names from 2001 through 2025 (the last year in the dataset). Here’s the start of a simple interactive Python session that does it:
>>> import pandas as pd
>>> df = pd.read_csv('all-years.csv')
>>> cols = ['Name', 'Count']
This reads the CSV file into a dataframe and defines the columns of the dataframe that we want to include in our output. The >>> at the beginning of each line is the interactive Python prompt. Here’s how we get the list of names we’re interested in:
>>> df[(df.Sex=='F') & (df.Year>2000)][cols].groupby('Name')\
... .sum().sort_values('Count', ascending=False)[:5]
           Count
Name
Emma      449576
Olivia    423613
Isabella  381577
Sophia    368619
Emily     353077
The ... indicates a continuation input line. Everything after that is output.
Reading through the command, we see that we’re
- getting the subset of data consisting of girls born after 2000;
- limiting the output to the Name and Count fields;
- grouping the output by Name;
- summing the Counts for each Name;
- sorting the results by Count in descending order; and
- limiting the output to the top five names.
That’s obviously a long command, but you can see how it’s constructed in a logical fashion.
If we want to compare these to the popular girls’ names from a century earlier, the command is very similar:
>>> df[(df.Sex=='F') & (df.Year>1900) & (df.Year<=1925)][cols].groupby('Name')\
... .sum().sort_values('Count', ascending=False)[:5]
            Count
Name
Mary      1056333
Helen      505522
Dorothy    475151
Margaret   402317
Ruth       364923
My wife and I had great aunts with some of these names.
If you’re a database maven, you recognize the Pandas groupby function as a copy of the SQL GROUP BY construct. Let’s redo this in an interactive session with SQLite. We start by importing the data from the CSV file:
sqlite> .mode csv
sqlite> .import all-years.csv names
sqlite> .mode columns
The mode is set to csv in order to import the data, then set back to columns to make the output look the way we want.
Now we get the top five girls’ names from the 21st century and show them in descending order:
sqlite> select Name, sum(Count) from names
     ...> where Sex is "F" and Year > 2000
     ...> group by Name order by sum(Count) desc limit 5;
Name      sum(Count)
--------  ----------
Emma      449576
Olivia    423613
Isabella  381577
Sophia    368619
Emily     353077
SQL is certainly more English-like, but you can see the parallels between it and Pandas. Now for the early 20th century:
sqlite> select Name, sum(Count) from names
     ...> where Sex is "F" and Year > 1900 and Year <= 1925
     ...> group by Name order by sum(Count) desc limit 5;
Name      sum(Count)
--------  ----------
Mary      1056333
Helen     505522
Dorothy   475151
Margaret  402317
Ruth      364923
Allison does similar things with her truncated Excel file using pivot tables. I hate the name “pivot table,” because I think it’s an obscure term for the simple operations of grouping and summarizing. For some reason, my feelings on this don’t matter, and pivot tables are here to stay. Pandas has even added a pivot_table function to placate people who’ve come over from Excel. Under the hood, pivot_table calls groupby.
Well, that was kind of a long detour, and I forgive you if you’ve forgotten where we were. I had just gone through a list of things that made me leery of using spreadsheets—why my first rule of using spreadsheets is Don’t.
But I allow for exceptions. My two main exceptions are:
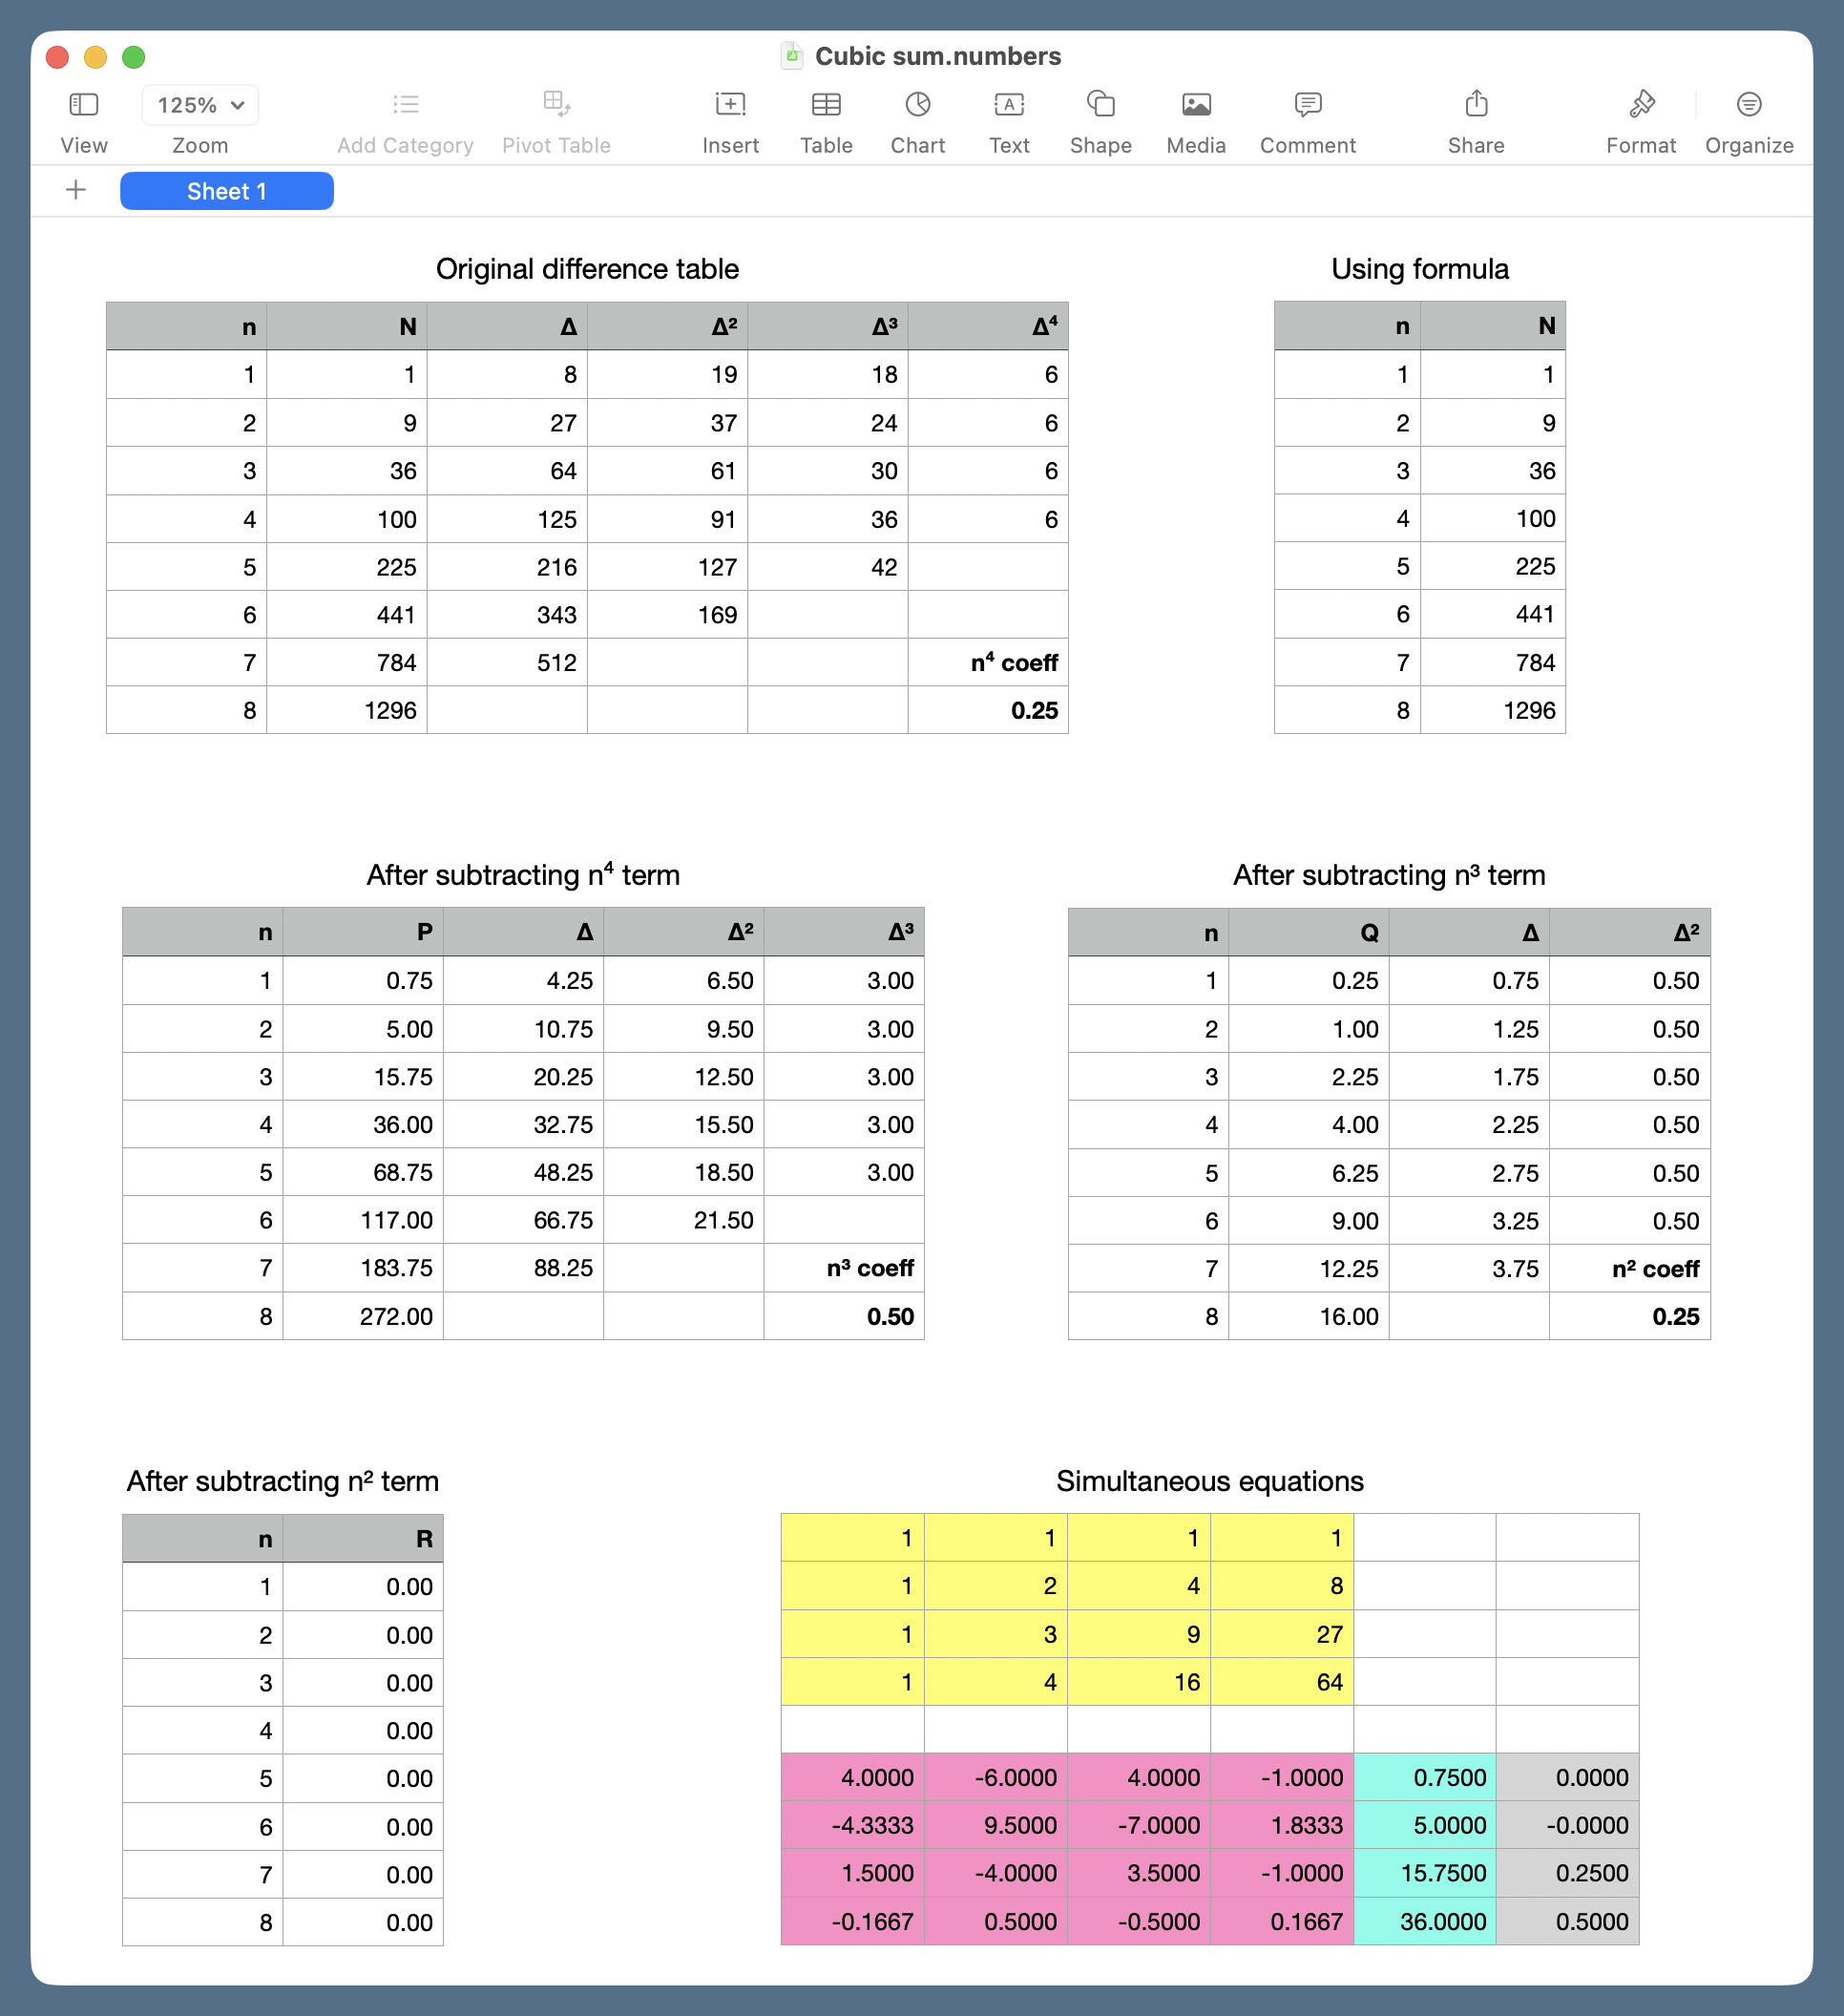
When the problem is both small enough to see on the screen with almost no scrolling and the operations are simple enough to be easily understood without counting commas and parentheses. That was what I did for my sum of cubes difference tables. The formulas consisted mainly of subtractions, with some power and division operations here and there. Only the simultaneous equations solution in the lower right involved actual function calls, and there were no nested calls.
- When I’m using the spreadsheet as a way station for editing data before passing it along. I did that in the baseball team progress post to edit down the large and unwieldy season results tables from Baseball Reference. It was fast and easy to select the table in Safari, paste it into Numbers, and then delete the columns and rows I didn’t need. But I did it this way only because this was a one-off project. If I were given the job of making progress charts for all 30 teams every day of the season, I’d never do it by hand like that. I’d use the Pandas
read_htmlfunction to pull the HTML table into a dataframe and a variety ofdropcommands to pare it down.
I used to use spreadsheets for data entry, too, but not anymore. It was once the only reliable way to put a table of numbers found in a book into electronic form. But OCR has gotten so much better, I can’t remember the last time I did this.
I know there are lots of people who love using spreadsheets. They’ve spent a lot of time learning the ins and outs and don’t want to switch to another tool. That’s fine. This post was about my rules, not anyone else’s. I’m not saying good, accurate, complex work can’t be done in spreadsheets. It just won’t be done by me.